|
My October Employment Preview
Goldman October Payrolls Preview Friday: • At 8:30 AM ET, Employment Report for October. The consensus is for 600 thousand jobs added, and for the unemployment rate to decrease to 7.6%. 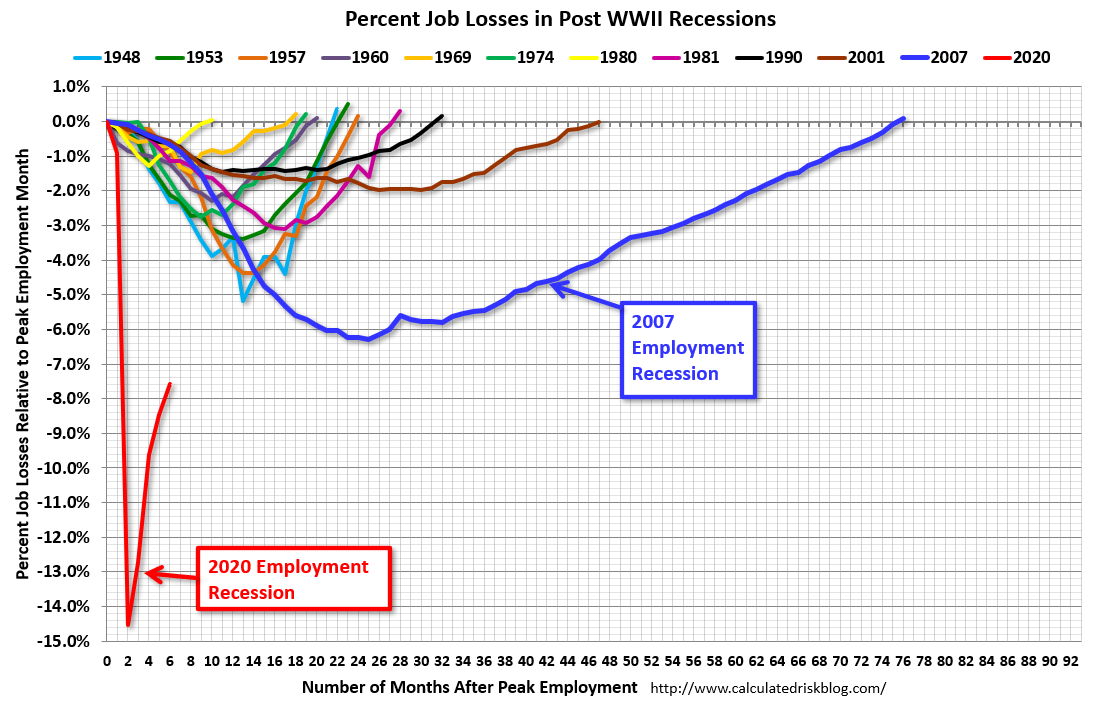 Click on graph for larger image. Click on graph for larger image.This graph shows the job losses from the start of the employment recession, in percentage terms through September. The current employment recession was by far the worst recession since WWII in percentage terms, and the worst in terms of the unemployment rate. from http://www.calculatedriskblog.com/2020/11/friday-employment-report.html
0 Comments
Note: I look forward to when I will not be posting this daily!
The US is now averaging close to 1 million tests per day. Based on the experience of other countries, for adequate test-and-trace (and isolation) to reduce infections, the percent positive needs to be well under 5% (probably close to 1%), so the US still needs to increase the number of tests per day significantly (or take actions to push down the number of new infections). There were 1,271,748 test results reported over the last 24 hours. There were 116,255 positive tests. (New record) Over 4,500 US deaths have been reported so far in November. See the graph on US Daily Deaths here.  Click on graph for larger image. Click on graph for larger image.This data is from the COVID Tracking Project. The percent positive over the last 24 hours was 9.1% (red line is 7 day average). For the status of contact tracing by state, check out testandtrace.com. And check out COVID Exit Strategy to see how each state is doing. 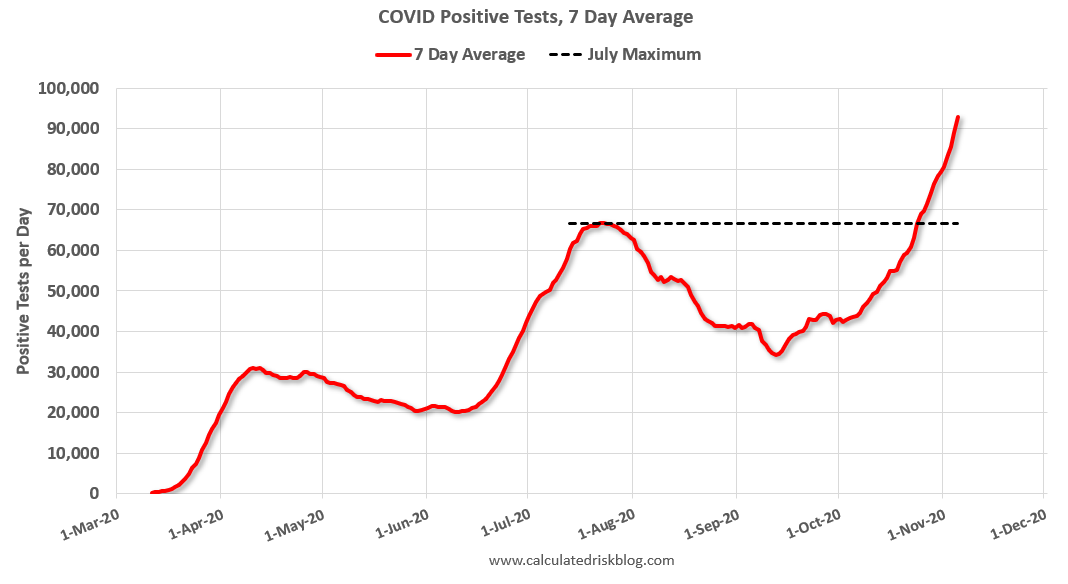 The second graph shows the 7 day average of positive tests reported. The second graph shows the 7 day average of positive tests reported.The dashed line is the July high. Note that there were very few tests available in March and April, and many cases were missed (the percent positive was very high - see first graph). By June, the percent positive had dropped below 5%. This is a new record 7-day average cases for the USA. from http://www.calculatedriskblog.com/2020/11/november-5-covid-19-test-results-record.html
A few brief excerpts from a note by Goldman Sachs economist Spencer Hill:
We estimate nonfarm payrolls rose 500k in October, below consensus of 600k. High-frequency labor market information indicates further deceleration in job growth, consistent with a drag from the virus resurgence and fiscal fizzle. ...CR Note: The consensus is for 600 thousand jobs added, and for the unemployment rate to decrease to 7.6%. from http://www.calculatedriskblog.com/2020/11/goldman-october-payrolls-preview.html
Fed Chair Powell press conference video here starting at 2:30 PM ET.
FOMC Statement: The Federal Reserve is committed to using its full range of tools to support the U.S. economy in this challenging time, thereby promoting its maximum employment and price stability goals. from http://www.calculatedriskblog.com/2020/11/fomc-statement-no-change.html
On Friday at 8:30 AM ET, the BLS will release the employment report for October. The consensus is for 600 thousand jobs added, and for the unemployment rate to decrease to 7.6%.
• Decennial Census: The decennial Census will subtract 147,311 temporary jobs. • ADP Report: The ADP employment report showed a gain of 365,000 private sector jobs, well below the consensus estimate of 650 thousand jobs. The ADP report hasn't been very useful in predicting the BLS report, but this suggests the BLS report could be weaker than expected. • ISM Surveys: The ISM manufacturing employment index increased in October to 53.2% from 49.6% in September, and is finally above 50. This would suggest essentially no change in manufacturing jobs in October - although ADP showed 7,000 manufacturing jobs added. The ISM Services employment index decreased in October to 50.1% from 51.8% in October, and is just above 50. This would suggest around 75,000 service jobs added in October. Combined, the ISM surveys suggest around 75,000 private sector jobs added in October. The ISM surveys haven't been as useful as usual during the pandemic, but this does suggest the report could be weaker than expected. • Unemployment Claims: The weekly claims report showed a high number of total continuing unemployment claims during the reference week, although this might not be very useful right now. If we did a "Rip Van Winkle", and saw the weekly claims report this morning, we'd think the economy was in a deep recession! • Homebase, Kronos/UKG: There are other indicators that analysts are looking at - like Homebase hours worked and Kronos (see Ernie Tedeschi comments).  Click on graph for larger image. Click on graph for larger image.
"Data from Homebase, Kronos/UKG, and UI claims since mid-September would be consistent with +801K jobs created in October, seasonally-adjusted.• Seasonal Retail Hiring: Typically retail companies start hiring for the holiday season in October, and really increase hiring in November. Here is a graph that shows the historical net retail jobs added for October, November and December by year. 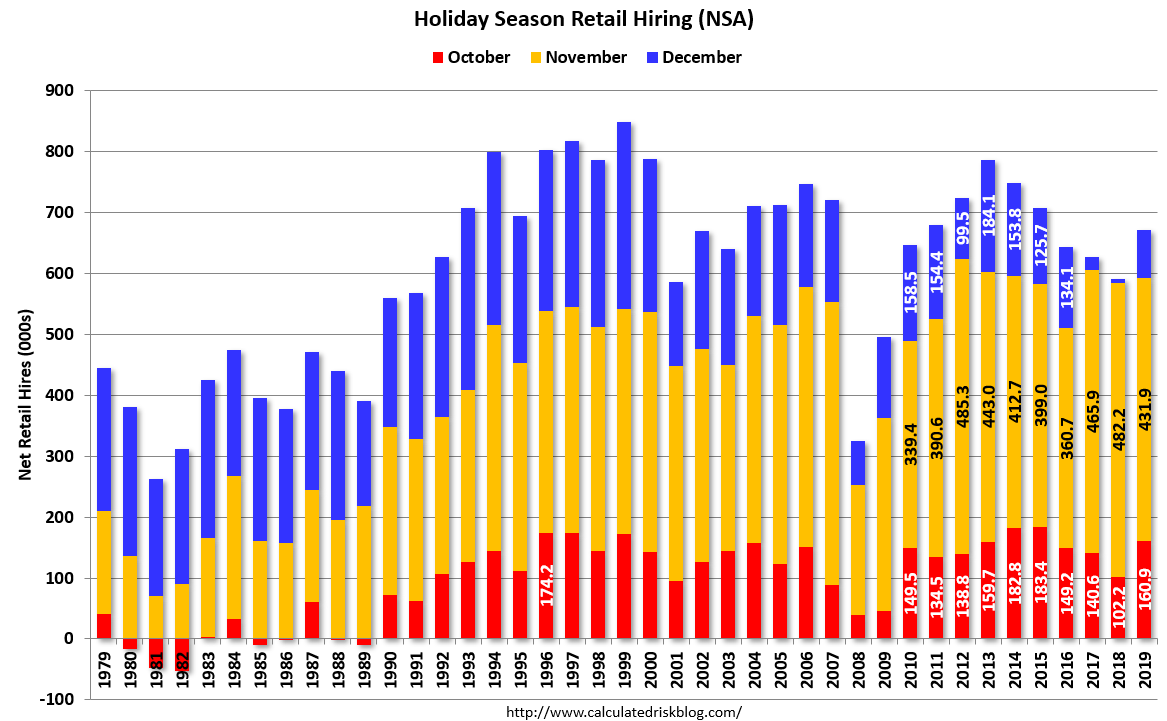 Click on graph for larger image. Click on graph for larger image.In 2019, retailers hired 161,000 seasonal employees (NSA) in October. This translated to a gain of 22,000 SA. Brick and Mortar retailers could be more cautious this year, and retail might decline SA in October.
There could even be a larger impact in November. In 2019, retailers hired 432,000 temporary employees NSA in November, and this translated to a loss of 14,000 jobs SA. This will be something to watch. 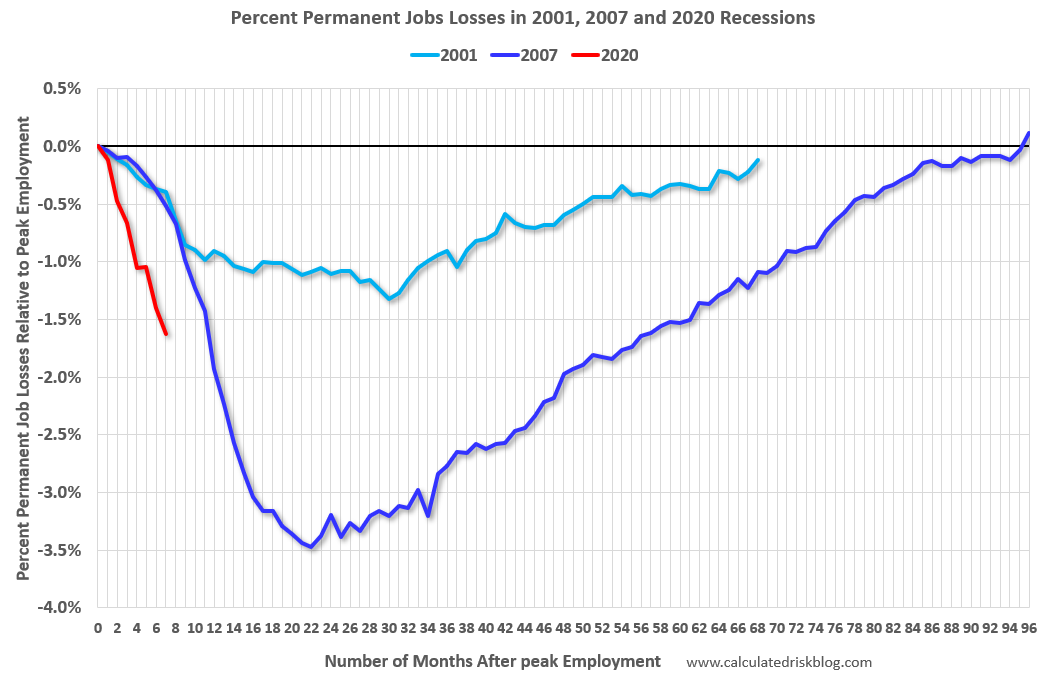 • Permanent Job Losers: Something to watch in the employment report will be "Permanent job losers". While there has been a strong bounce back in total employment, from the shutdown in March and April, permanent job losers have continued to increase. • Permanent Job Losers: Something to watch in the employment report will be "Permanent job losers". While there has been a strong bounce back in total employment, from the shutdown in March and April, permanent job losers have continued to increase.This graph shows permanent job losers as a percent of the pre-recession peak in employment through the September report. This data is only available back to 1994, so there is only data for three recessions. In September, the number of permanent job losers increased to 3.756 million from 3.411 million in August. • Merrill Lynch forecast: "The October jobs report will likely reveal a moderation in nonfarm payroll growth to 625k, down from 661k in September. Census workers will contribute a notable drag – excluding government, we expect solid private payroll growth of 800k. The unemployment rate will likely improve to 7.6% from 7.9% in September." • Conclusion: The employment related data has been all over the place, but most of the indicators suggest a weaker report in October than in September. My guess is the report will be lower than the consensus. from http://www.calculatedriskblog.com/2020/11/october-employment-preview.html
The DOL reported:
In the week ending October 31, the advance figure for seasonally adjusted initial claims was 751,000, a decrease of 7,000 from the previous week's revised level. The previous week's level was revised up by 7,000 from 751,000 to 758,000. The 4-week moving average was 787,000, a decrease of 4,000 from the previous week's revised average. The previous week's average was revised up by 3,250 from 787,750 to 791,000.This does not include the 362,883 initial claims for Pandemic Unemployment Assistance (PUA) that was up from 359,044 the previous week. (There are some questions on PUA numbers). The following graph shows the 4-week moving average of weekly claims since 1971. 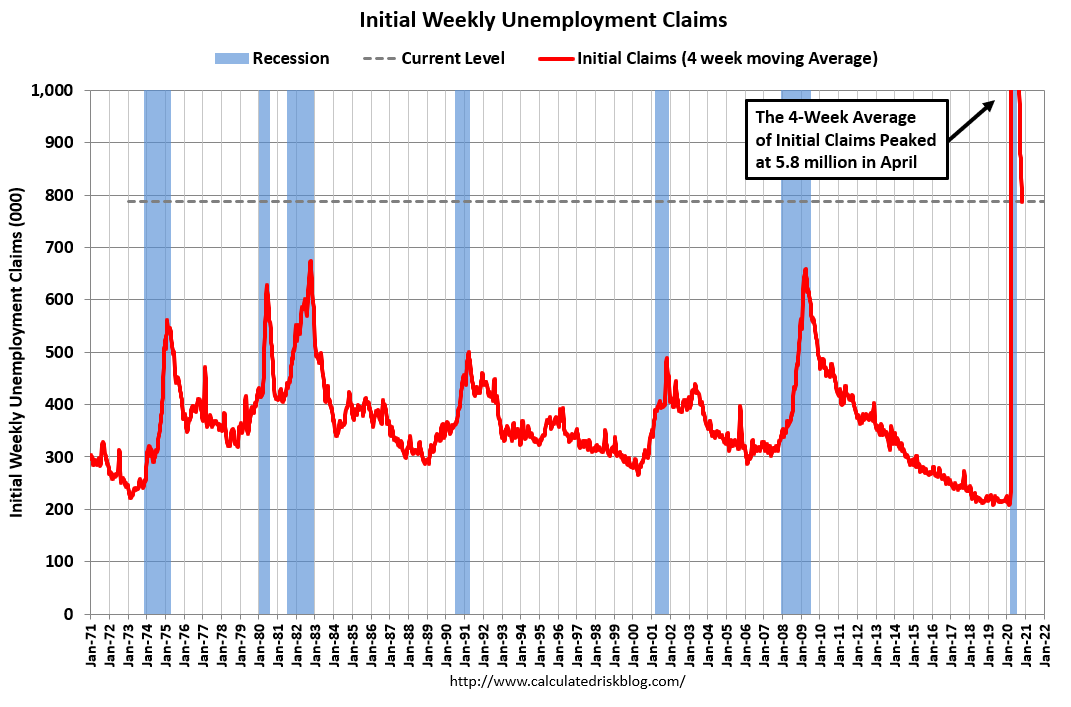 Click on graph for larger image. Click on graph for larger image.The dashed line on the graph is the current 4-week average. The four-week average of weekly unemployment claims decreased to 787,000. The previous week was revised up. The second graph shows seasonally adjust continued claims since 1967 (lags initial by one week). 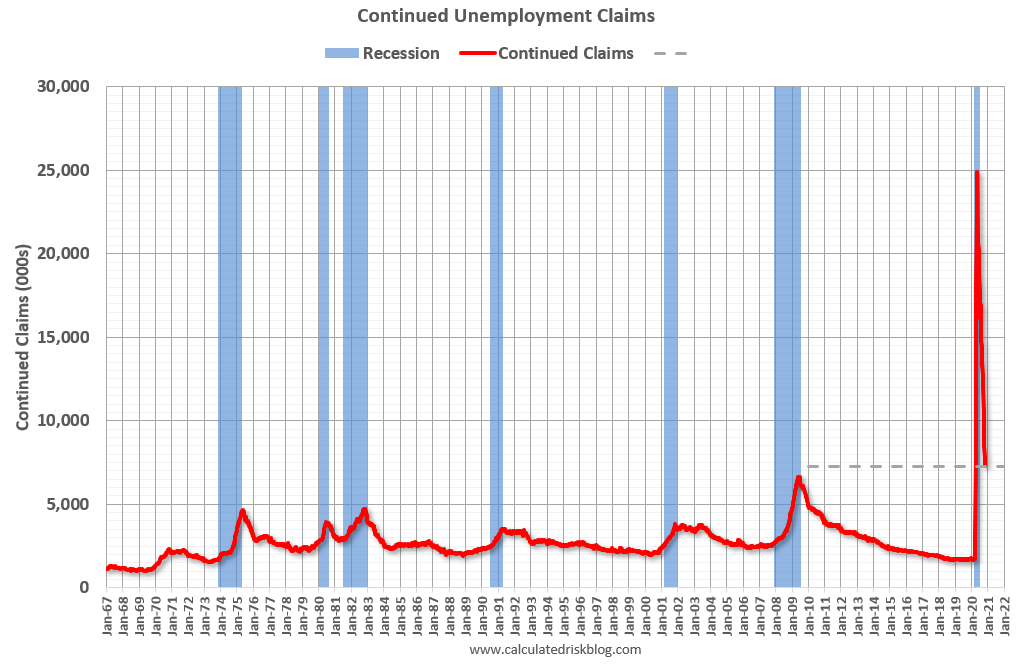 At the worst of the Great Recession, continued claims peaked at 6.635 million, but then steadily declined. At the worst of the Great Recession, continued claims peaked at 6.635 million, but then steadily declined.Continued claims decreased to 7,285,000 (SA) from 7,823,000 (SA) last week and will likely stay at a high level until the crisis abates. Note: There are an additional 9,332,610 receiving Pandemic Unemployment Assistance (PUA) that decreased from 10,324,779 the previous week (there are questions about these numbers). This is a special program for business owners, self-employed, independent contractors or gig workers not receiving other unemployment insurance.
An additional 3,961,060 are receiving Pandemic Emergency Unemployment Compensation (PEUC) that increased from 3,683,496 the previous week.
from http://www.calculatedriskblog.com/2020/11/weekly-initial-unemployment-claims-at.html
Thursday:
• At 8:30 AM ET, The initial weekly unemployment claims report will be released. The consensus is initial claims decreased to 725 thousand from 751 thousand last week. • At 2:00 PM, FOMC Meeting Announcement. No change in policy is expected at this meeting.. • At 2:30 PM, Fed Chair Jerome Powell holds a press briefing following the FOMC announcement. from http://www.calculatedriskblog.com/2020/11/thursday-fomc-announcement-unemployment.html
Note: I look forward to when I will not be posting this daily!
The US is now averaging close to 1 million tests per day. Based on the experience of other countries, for adequate test-and-trace (and isolation) to reduce infections, the percent positive needs to be well under 5% (probably close to 1%), so the US still needs to increase the number of tests per day significantly (or take actions to push down the number of new infections). There were 966,851 test results reported over the last 24 hours. There were 103,087 positive tests. (New record) Over 3,500 US deaths have been reported so far in November. See the graph on US Daily Deaths here. 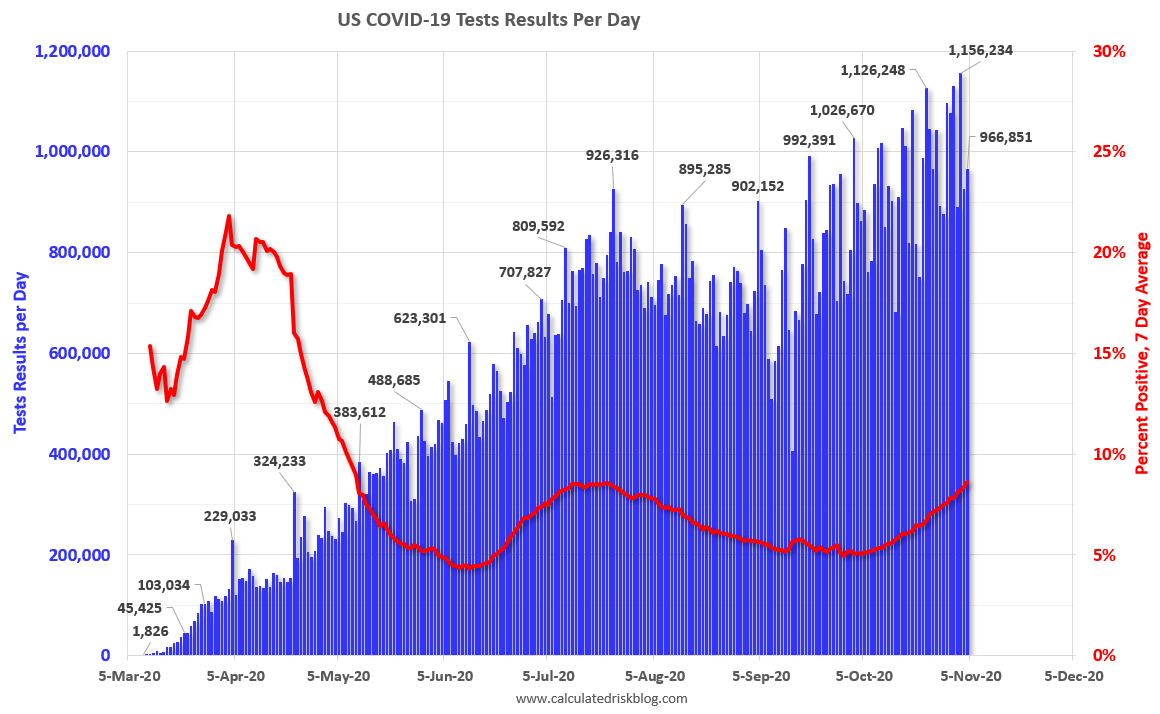 Click on graph for larger image. Click on graph for larger image.This data is from the COVID Tracking Project. The percent positive over the last 24 hours was 10.7% (red line is 7 day average). For the status of contact tracing by state, check out testandtrace.com. And check out COVID Exit Strategy to see how each state is doing.  The second graph shows the 7 day average of positive tests reported. The second graph shows the 7 day average of positive tests reported.The dashed line is the July high. Note that there were very few tests available in March and April, and many cases were missed (the percent positive was very high - see first graph). By June, the percent positive had dropped below 5%. This is a new record 7-day average cases for the USA. from http://www.calculatedriskblog.com/2020/11/november-4-covid-19-test-results-over.html
The BEA released their estimate of light vehicle sales for October this morning. The BEA estimates sales of 16.21 million SAAR in October 2020 (Seasonally Adjusted Annual Rate), down 0.5% from the September sales rate, and down 3.3% from October 2019.
This was below the consensus estimate of 16.5 million SAAR. 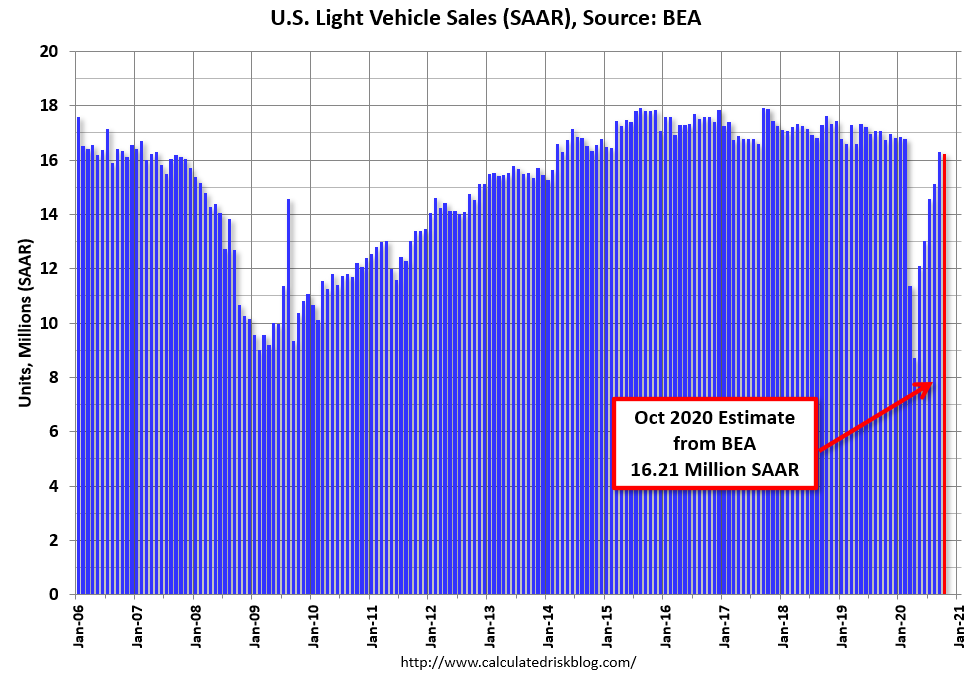 Click on graph for larger image. Click on graph for larger image.This graph shows light vehicle sales since 2006 from the BEA (blue) and the BEA's estimate for October (red). The impact of COVID-19 was significant, and April was the worst month. Since April, sales have increased, but are still down 3.3% from last year. The second graph shows light vehicle sales since the BEA started keeping data in 1967. 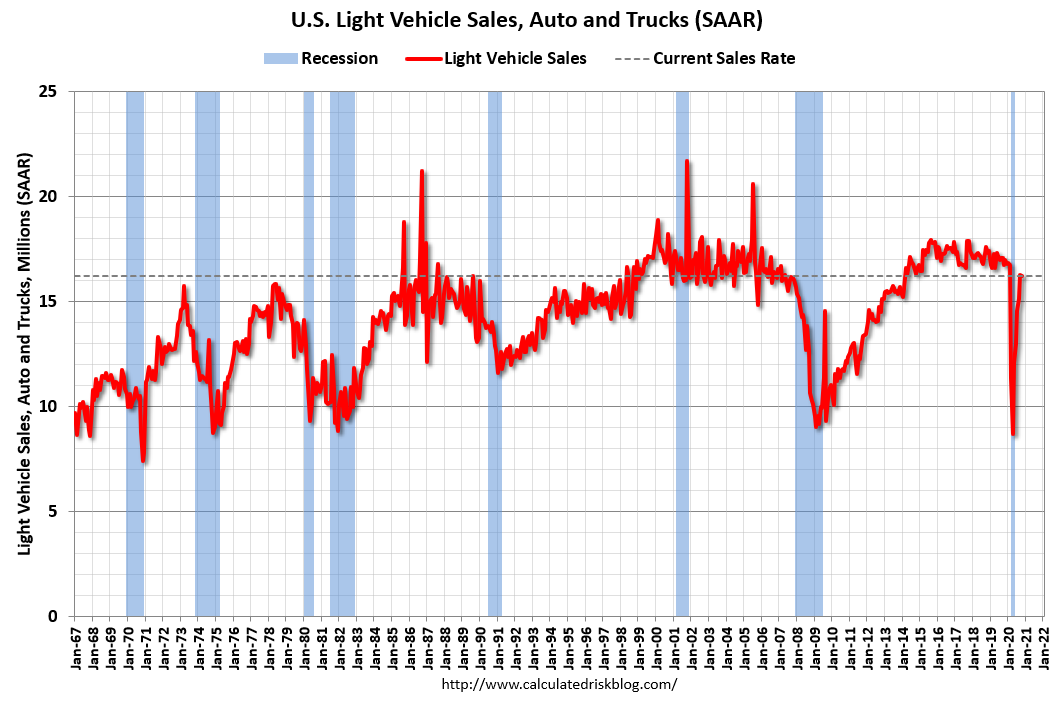 Note: dashed line is current estimated sales rate of 16.21 million SAAR. Note: dashed line is current estimated sales rate of 16.21 million SAAR.Sales-to-date are down 17.3% in 2020 compared to the same period in 2019. In 2019, there were 14.48 million light vehicle sales through October. In 2020, there have been 11.97 million sales. from http://www.calculatedriskblog.com/2020/11/october-vehicles-sales-decreased-to-162.html
The October ISM Services index was at 56.6%, down from 57.8% last month. The employment index decreased to 50.1%, from 51.8%. Note: Above 50 indicates expansion, below 50 contraction.
From the Institute for Supply Management: Services PMI™ at 56.6%; October 2020 Services ISM® Report On Business® Business Activity Index at 61.2%; New Orders Index at 58.8%; Employment Index at 50.1%; Supplier Deliveries Index at 56.2% 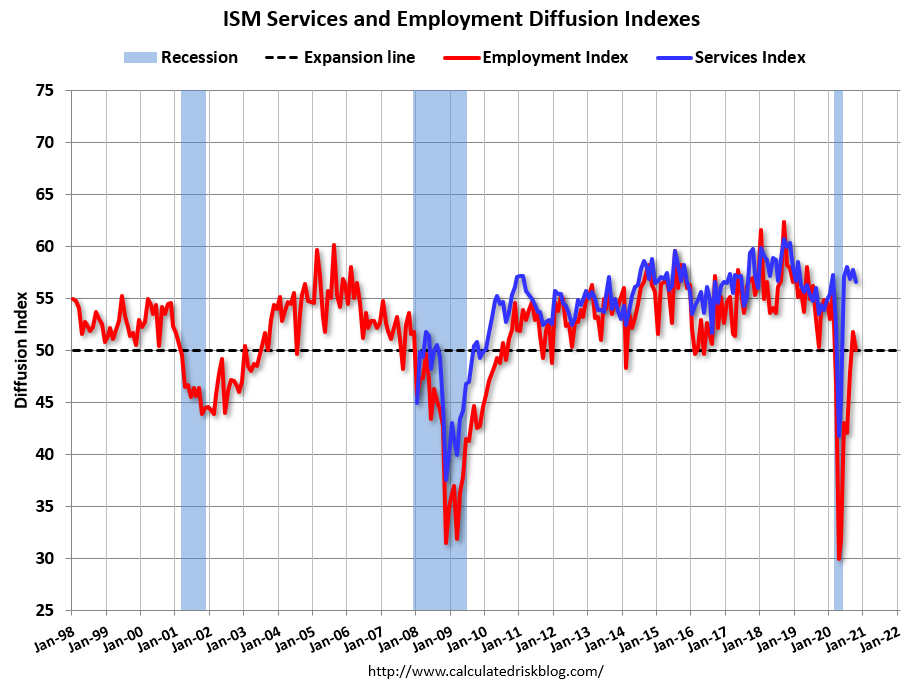 Click on graph for larger image. Click on graph for larger image.This graph shows the ISM services index (started in January 2008) and the ISM services employment diffusion index. This was below the consensus forecast, and the employment index was barely above 50. from http://www.calculatedriskblog.com/2020/11/ism-services-index-decreased-to-566-in.html |
 RSS Feed
