|
Note: I look forward to when I will not be posting this daily!
The US is now averaging close to 1 million tests per day. Based on the experience of other countries, for adequate test-and-trace (and isolation) to reduce infections, the percent positive needs to be well under 5% (probably close to 1%), so the US still needs to increase the number of tests per day significantly (or take actions to push down the number of new infections). There were 1,068,815 test results reported over the last 24 hours. There were 128,396 positive tests. (New record) Almost 7,000 US deaths have been reported so far in November. See the graph on US Daily Deaths here.  Click on graph for larger image. Click on graph for larger image.This data is from the COVID Tracking Project. The percent positive over the last 24 hours was 12.0% (red line is 7 day average). For the status of contact tracing by state, check out testandtrace.com. And check out COVID Exit Strategy to see how each state is doing. 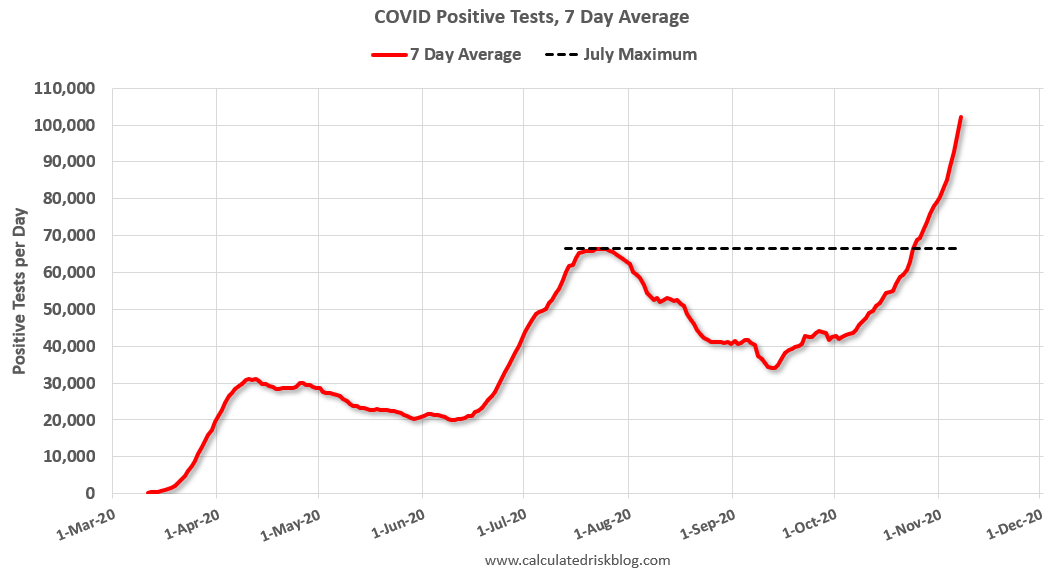 The second graph shows the 7 day average of positive tests reported. The second graph shows the 7 day average of positive tests reported.The dashed line is the July high. Note that there were very few tests available in March and April, and many cases were missed (the percent positive was very high - see first graph). By June, the percent positive had dropped below 5%. This is a new record 7-day average cases for the USA. from http://www.calculatedriskblog.com/2020/11/november-7-covid-19-test-results-record.html
0 Comments
From HotelNewsNow.com: STR: US hotel results for week ending 31 October
U.S. weekly hotel occupancy was the lowest for any week since late June, according to the latest data from STR through 31 October.Since there is a seasonal pattern to the occupancy rate - see graph below - we can track the year-over-year change in occupancy to look for any improvement. This table shows the year-over-year change since the week ending Sept 19, 2020:
This suggests little improvement over the last 7 weeks, but not as bad as "lowest since June" would suggest. Some of the recent decline in the occupancy rate is just seasonal. The following graph shows the seasonal pattern for the hotel occupancy rate using the four week average. 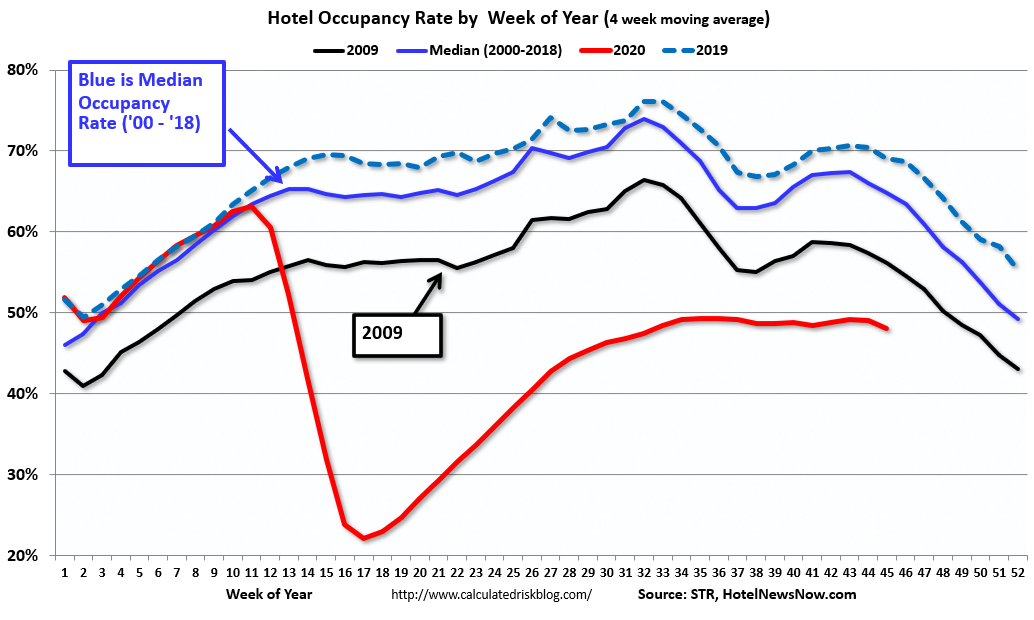 Click on graph for larger image. Click on graph for larger image.The red line is for 2020, dash light blue is 2019, blue is the median, and black is for 2009 (the worst year since the Great Depression for hotels - before 2020). Seasonally we'd expect the occupancy rate to decline into the new year. Note that there was little pickup in business travel that usually happens in the Fall. Note: Y-axis doesn't start at zero to better show the seasonal change. from http://www.calculatedriskblog.com/2020/11/hotels-occupancy-rate-declined-29-year.html
The key economic report this week is October CPI.
2:00 PM: Senior Loan Officer Opinion Survey on Bank Lending Practices for October. 6:00 AM: NFIB Small Business Optimism Index for October. 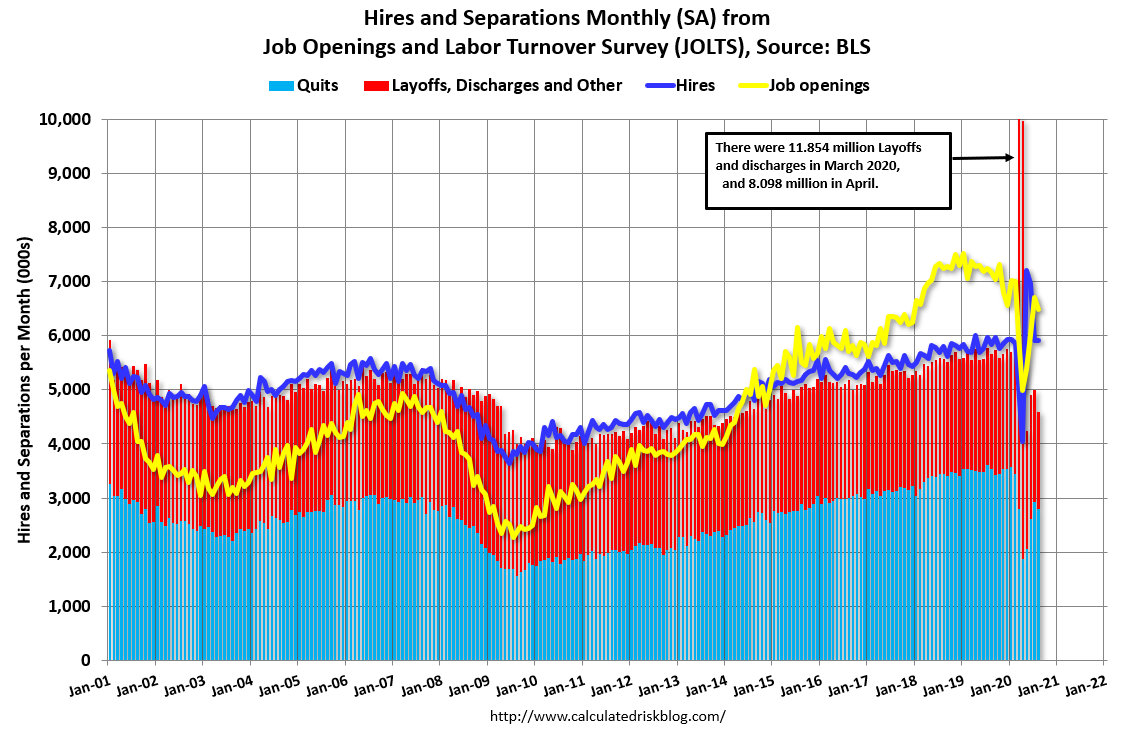 10:00 AM ET: Job Openings and Labor Turnover Survey for September from the BLS. 10:00 AM ET: Job Openings and Labor Turnover Survey for September from the BLS.This graph shows job openings (yellow line), hires (purple), Layoff, Discharges and other (red column), and Quits (light blue column) from the JOLTS. Jobs openings decreased in August to 6.493 million from 6.697 million in July. Veterans Day Holiday: Most banks will be closed in observance of Veterans Day. The stock market will be open. 7:00 AM ET: The Mortgage Bankers Association (MBA) will release the results for the mortgage purchase applications index. 8:30 AM: The initial weekly unemployment claims report will be released. The consensus is initial claims decreased to 725 thousand from 751 thousand last week. 8:30 AM: The Consumer Price Index for October from the BLS. The consensus is for a 0.2% increase in CPI, and a 0.2% increase in core CPI. 8:30 AM: The Producer Price Index for October from the BLS. The consensus is for a 0.2% increase in PPI, and a 0.2% increase in core PPI. 10:00 AM: University of Michigan's Consumer sentiment index (Preliminary for November). from http://www.calculatedriskblog.com/2020/11/schedule-for-week-of-november-8-2020.html
Note: I look forward to when I will not be posting this daily!
The US is now averaging close to 1 million tests per day. Based on the experience of other countries, for adequate test-and-trace (and isolation) to reduce infections, the percent positive needs to be well under 5% (probably close to 1%), so the US still needs to increase the number of tests per day significantly (or take actions to push down the number of new infections). There were 1,238,980 test results reported over the last 24 hours. There were 125,552 positive tests. (New record) Over 5,800 US deaths have been reported so far in November. See the graph on US Daily Deaths here. 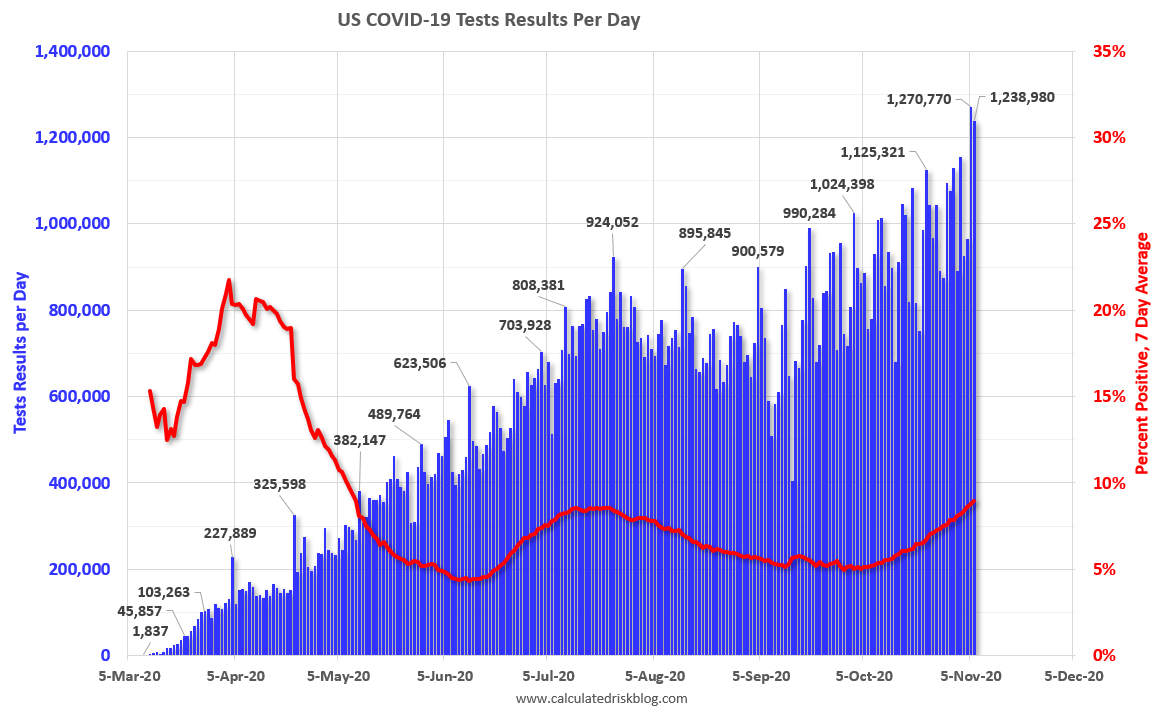 Click on graph for larger image. Click on graph for larger image.This data is from the COVID Tracking Project. The percent positive over the last 24 hours was 10.1% (red line is 7 day average). For the status of contact tracing by state, check out testandtrace.com. And check out COVID Exit Strategy to see how each state is doing. 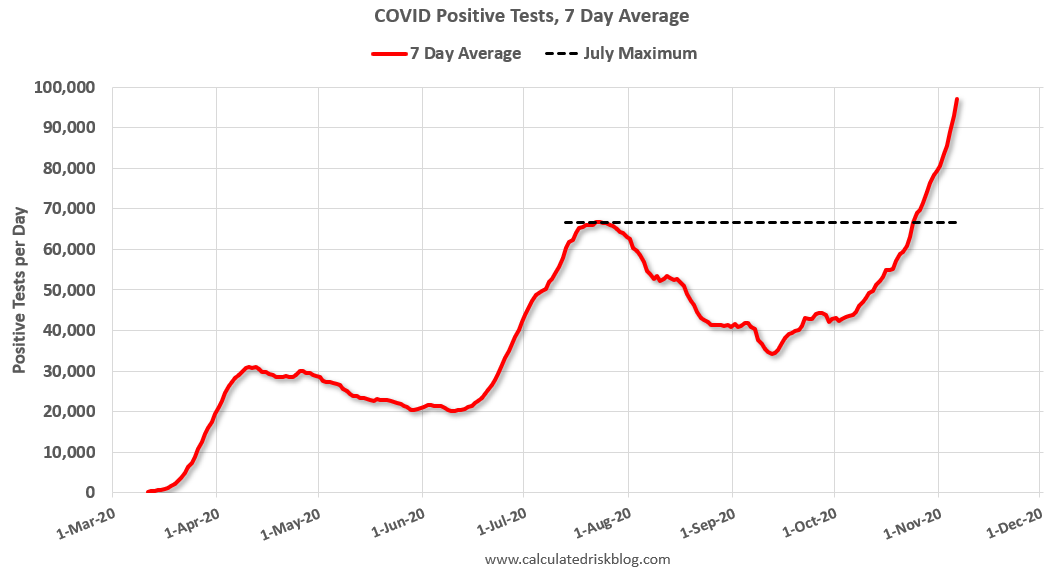 The second graph shows the 7 day average of positive tests reported. The second graph shows the 7 day average of positive tests reported.The dashed line is the July high. Note that there were very few tests available in March and April, and many cases were missed (the percent positive was very high - see first graph). By June, the percent positive had dropped below 5%. This is a new record 7-day average cases for the USA. from http://www.calculatedriskblog.com/2020/11/november-6-covid-19-test-results-record.html
The Northwest Multiple Listing Service reported October Statistical Data
The Northwest MLS report recapping October activity showed a 40% drop in active listings compared to the same month a year ago, an increase of 16% in pending sales (mutually accepted offers), and a year-over-year (YOY) jump of nearly 30% in closed sales. The median price of single family homes and condominiums that sold last month was $500,000, up 19% from the same period a year ago, according to the MLS summary, which encompasses 23 counties, mostly in Western and Central Washington.The press release is for the Northwest MLS area. There were 10,806 sales in October 2020, up 29.7% from 8,335 sales in October 2019. In King County, sales were up 40% year-over-year, and active inventory was down 21% year-over-year. In Seattle, sales were up 39.9% year-over-year, and inventory was up 16% year-over-year.. This puts the months-of-supply in Seattle at just 1.7 months. from http://www.calculatedriskblog.com/2020/11/seattle-real-estate-in-october-sales-up.html
From the Association of American Railroads (AAR) Rail Time Indicators. Graphs and excerpts reprinted with permission.
Back in April 2020, when the U.S. economy was basically in a coma, U.S. intermodal originations averaged 219,085 units per week. That was the fewest for any month in more than seven years and the fewest for April in ten years. Back then, no one would have thought that six months later, in October 2020, U.S. railroads would have their best intermodal month in history. Yet that’s where we are: U.S. railroads originated an average of 292,469 containers and trailers per week in October 2020, more than ever before and up a stunning 33.5% over April 2020. 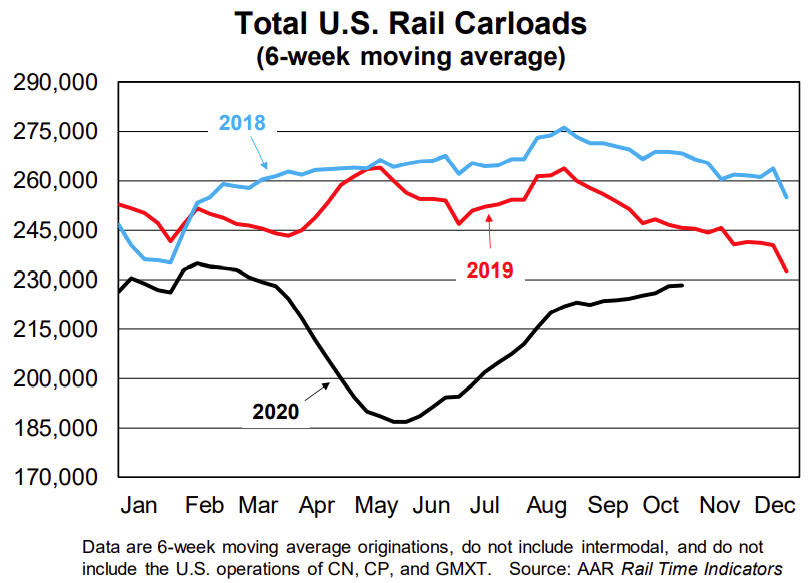 Click on graph for larger image. Click on graph for larger image.This graph from the Rail Time Indicators report shows the six week average of U.S. Carloads in 2018, 2019 and 2020: Total U.S. carloads are trending higher, but at a much slower pace than in July and August. U.S. railroads originated an average of 228,193 total carloads per week in October 2020, the most since February 2020 but down 6.6% from October 2019. The 6.6% year-over-year decline is the smallest since the pandemic began. 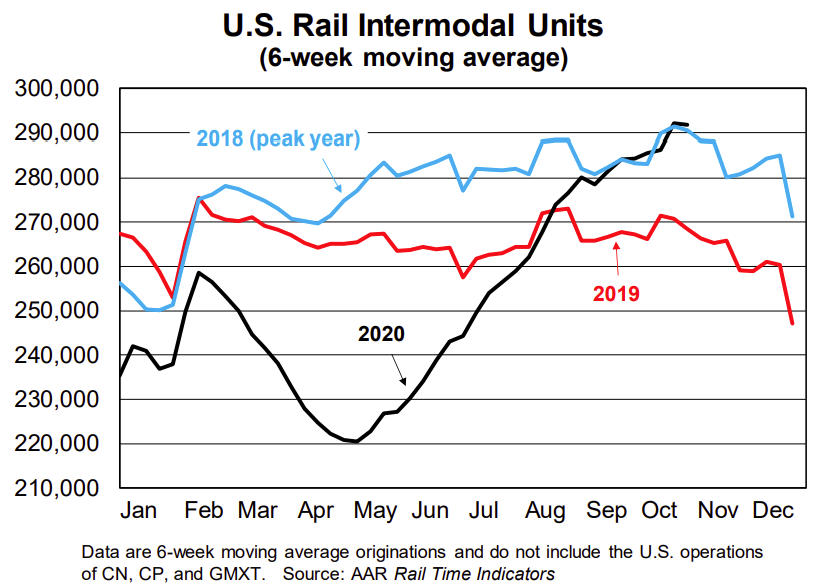 The second graph shows the six week average of U.S. intermodal in 2018, 2019 and 2020: (using intermodal or shipping containers): The second graph shows the six week average of U.S. intermodal in 2018, 2019 and 2020: (using intermodal or shipping containers):In the 31 years from 1989 to 2019, October was the top U.S. rail intermodal month (in terms of average weekly originations) 25 times. This year will make 26. In October 2020, U.S. railroads originated an average of 292,469 containers and trailers per week, up 10.0% over October 2019 and the highest weekly average for any month in history. (The previous record was 289,994 in June 2018.) The weekly average in October 2020 was 33.5% higher than in April 2020, when they averaged just 219,085 units. That’s the biggest six-month gain in history. Few would have expected that six months ago.Note that rail traffic was weak prior to the pandemic, and intermodal has come back strong. from http://www.calculatedriskblog.com/2020/11/aar-october-rail-carloads-down-66-yoy.html
This report is for closed sales in October; sales are counted at the close of escrow, so the contracts for these homes were mostly signed in August and September.
The Las Vegas Realtors reported With rising prices and supply not meeting demand, local housing market looking like rest of U.S.; LVR housing statistics for October 2020 “COVID-19 appears to have extended the typical summer buying period by several months,” said 2020 LVR President Tom Blanchard, a longtime local REALTOR®. “The continued demand in our housing market is still not being met and is putting upward pressure on home values. Although we see increased permits by local homebuilders, they are still not meeting the demand that is out there.”1) Overall sales were up 10.9% year-over-year to 3,961 in October 2020 from 3,571 in October 2019. 2) Active inventory (single-family and condos) is down from a year ago, from a total of 9,164 in September 2019 to 5,929 in September 2020. Note: Total inventory was down 34.3% year-over-year. And months of inventory is low. 3) Low level of distressed sales. from http://www.calculatedriskblog.com/2020/11/las-vegas-real-estate-in-october-sales.html
The October employment report was at expectations, and employment for the previous two months were revised up slightly.
Government employment declined 268 thousand in October. The job losses at the Federal level were due to letting go temporary decennial workers, but 130 thousand jobs were lost at state and local governments. These losses could increase sharply if there is no disaster relief for the states. I'll have more on this. Leisure and hospitality added another 271 thousand jobs in October, following 4.56 million jobs added in May through September. Leisure and hospitality lost 8.3 million jobs in March and April, so about 58% of those jobs were added back in the May through October period. Earlier: October Employment Report: 638 Thousand Jobs Added, 6.9% Unemployment Rate In October, the year-over-year employment change was minus 9.18 million jobs. Permanent Job Losers 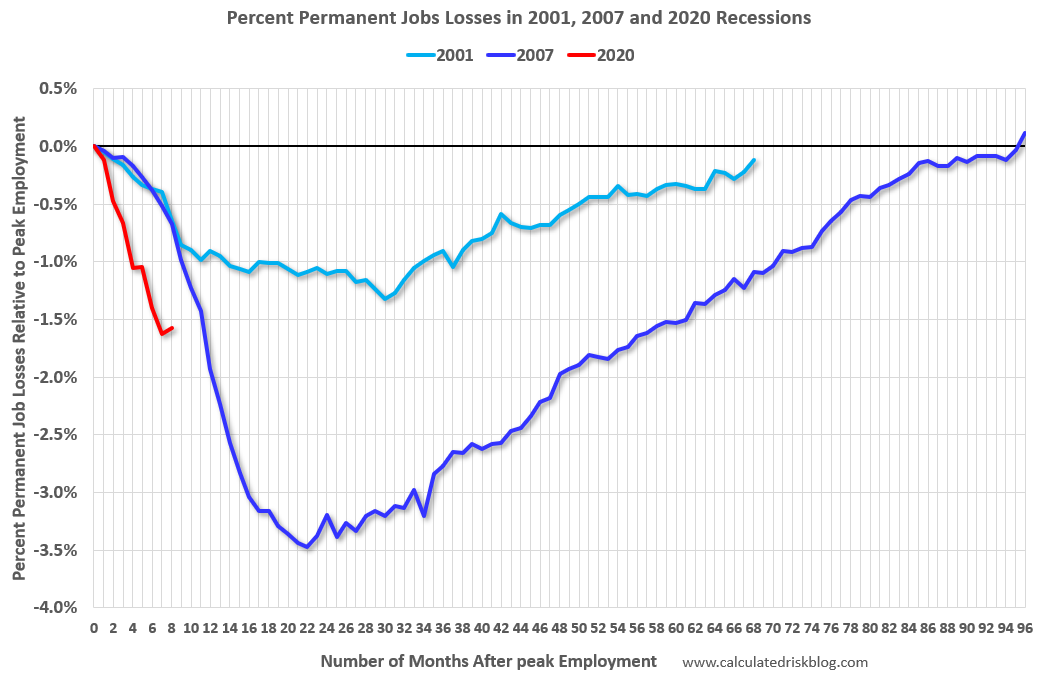 Click on graph for larger image. Click on graph for larger image.This graph shows permanent job losers as a percent of the pre-recession peak in employment through the October report. (ht Joe Weisenthal at Bloomberg) This data is only available back to 1994, so there is only data for three recessions. In October, the number of permanent job losers decreased to 3.684 million from 3.756 million in September. Prime (25 to 54 Years Old) Participation  Since the overall participation rate has declined due to cyclical (recession) and demographic (aging population, younger people staying in school) reasons, here is the employment-population ratio for the key working age group: 25 to 54 years old. Since the overall participation rate has declined due to cyclical (recession) and demographic (aging population, younger people staying in school) reasons, here is the employment-population ratio for the key working age group: 25 to 54 years old.The prime working age will be key in the eventual recovery. The 25 to 54 participation rate increased in October 81.2% to from 80.9% in September, and the 25 to 54 employment population ratio increased to 76.0% from 75.0%. Seasonal Retail Hiring Typically retail companies start hiring for the holiday season in October, and really increase hiring in November. Here is a graph that shows the historical net retail jobs added for October, November and December by year. 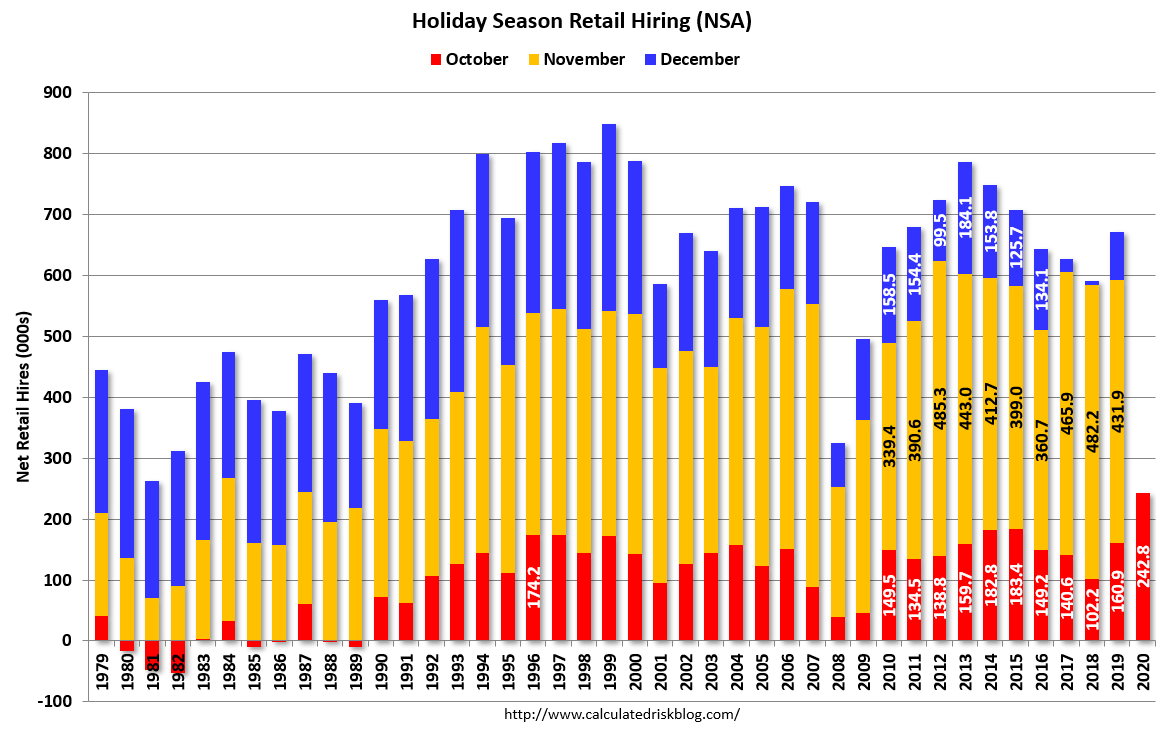 This graph really shows the collapse in retail hiring in 2008. Since then seasonal hiring had increased back close to more normal levels. Note: I expect the long term trend will be down with more and more internet holiday shopping. This graph really shows the collapse in retail hiring in 2008. Since then seasonal hiring had increased back close to more normal levels. Note: I expect the long term trend will be down with more and more internet holiday shopping.Retailers hired 243 thousand workers (NSA) net in October. Note: this is NSA (Not Seasonally Adjusted). This might be distorted this year by a combination of seasonal hiring - and some bounce back in employment from the shutdowns earlier this year. Part Time for Economic Reasons 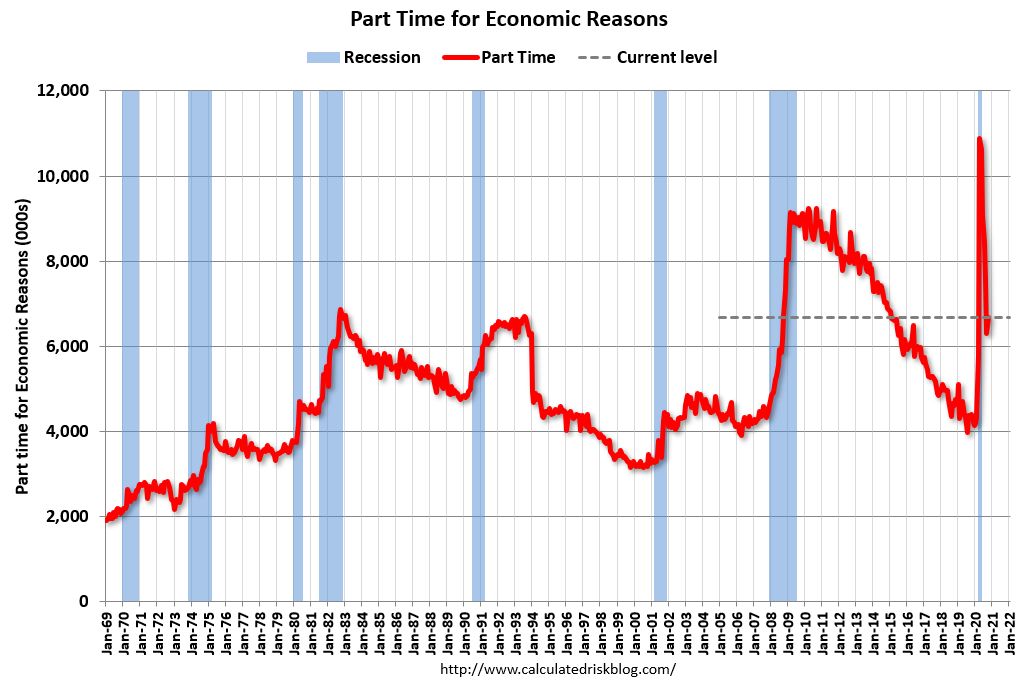 From the BLS report: From the BLS report:"The number of persons employed part time for economic reasons increased by 383,000 to 6.7 million in October, after declines totaling 4.6 million over the prior 5 months. These individuals, who would have preferred full-time employment, were working part time because their hours had been reduced or they were unable to find full-time jobs."The number of persons working part time for economic reasons increased in October to 6.684 million from 6.300 million in September. These workers are included in the alternate measure of labor underutilization (U-6) that decreased to 12.1% in October. This is down from the record high in April 22.8% for this measure since 1994. Unemployed over 26 Weeks 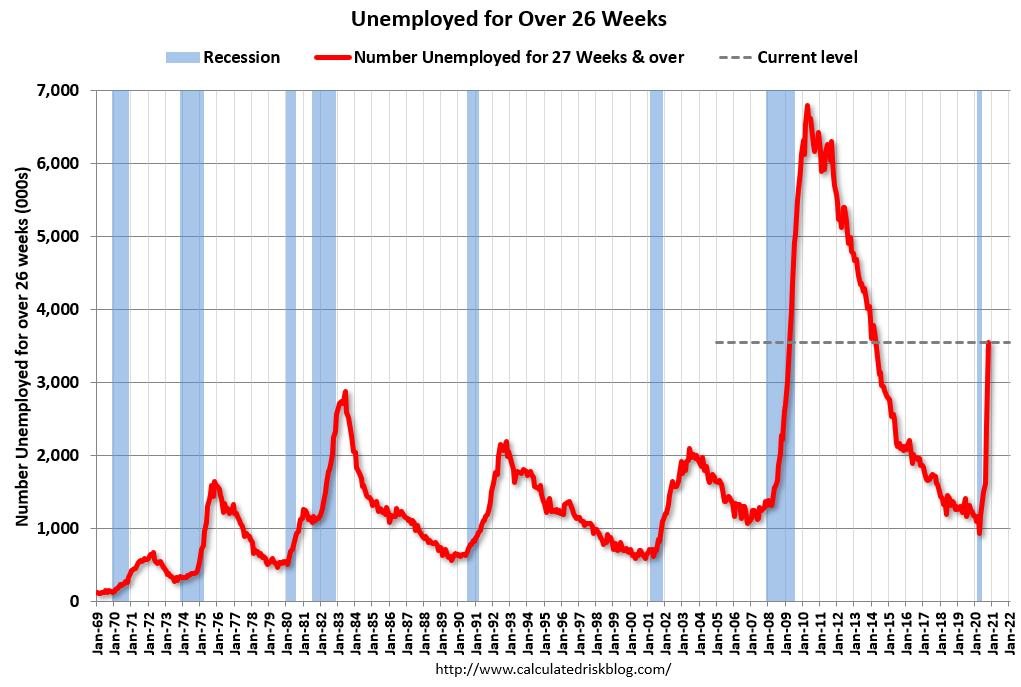 This graph shows the number of workers unemployed for 27 weeks or more. This graph shows the number of workers unemployed for 27 weeks or more.According to the BLS, there are 3.556 million workers who have been unemployed for more than 26 weeks and still want a job. This increased sharply in October - since the largest number of layoffs were in April - and will be a key measure to follow during the recovery. Summary: The headline monthly jobs number was at expectations, and the previous two months were revised up 15,000 combined. The headline unemployment rate decreased to 6.9%. However the number of part time workers increased, and the number of long term unemployed increased sharply. from http://www.calculatedriskblog.com/2020/11/comments-on-october-employment-report.html
From the BLS:
Total nonfarm payroll employment rose by 638,000 in October, and the unemployment rate declined to 6.9 percent, the U.S. Bureau of Labor Statistics reported today. These improvements in the labor market reflect the continued resumption of economic activity that had been curtailed due to the coronavirus (COVID-19) pandemic and efforts to contain it. In October, notable job gains occurred in leisure and hospitality, professional and business services, retail trade, and construction. Employment in government declined.  Click on graph for larger image. Click on graph for larger image.The first graph shows the year-over-year change in total non-farm employment since 1968. In October, the year-over-year change was negative 9.18 million jobs. Total payrolls increased by 638 thousand in October. Payrolls for August and September were revised up 15 thousand combined. 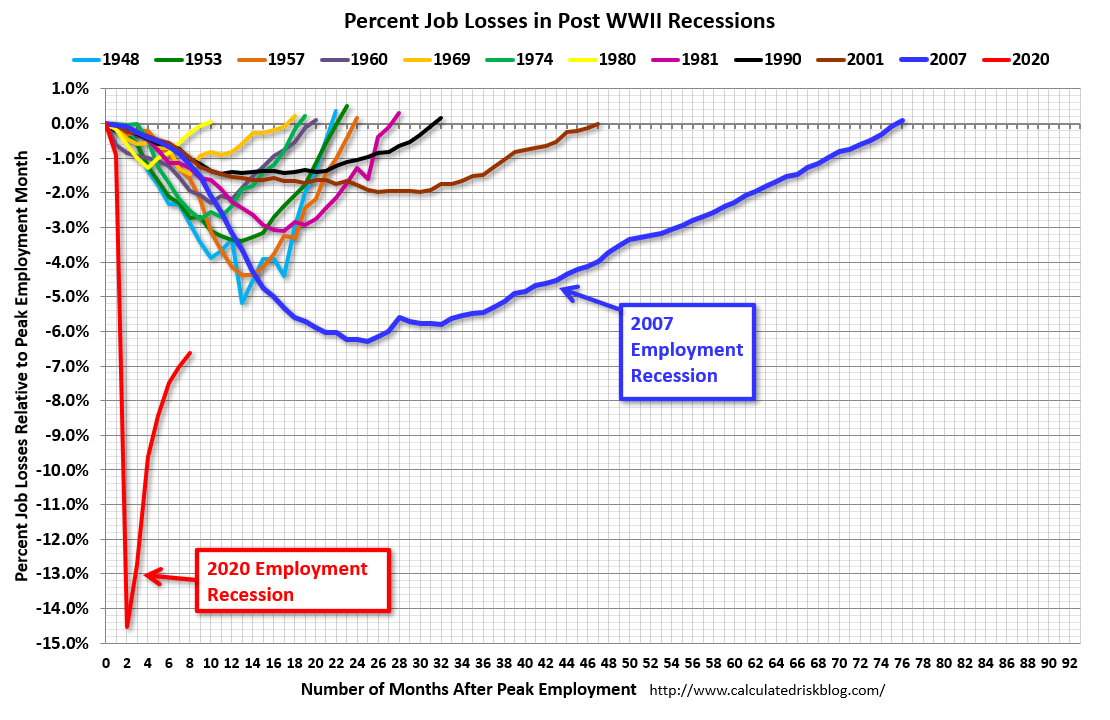 The second graph shows the job losses from the start of the employment recession, in percentage terms. The second graph shows the job losses from the start of the employment recession, in percentage terms.The current employment recession is by far the worst recession since WWII in percentage terms, and is still worse than the worst of the "Great Recession". The third graph shows the employment population ratio and the participation rate.  The Labor Force Participation Rate increased to 61.7% in October. This is the percentage of the working age population in the labor force. The Labor Force Participation Rate increased to 61.7% in October. This is the percentage of the working age population in the labor force.The Employment-Population ratio increased to 57.4% (black line). I'll post the 25 to 54 age group employment-population ratio graph later. 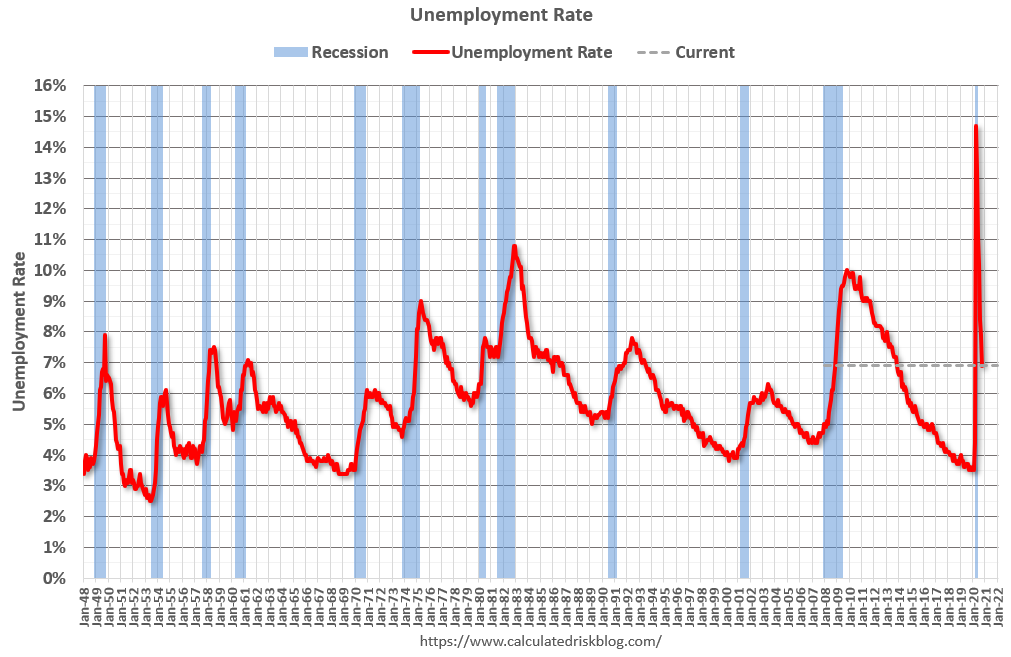 The fourth graph shows the unemployment rate. The fourth graph shows the unemployment rate.The unemployment rate decreased in October to 6.9%. This was close to consensus expectations, and August and September were revised up by 15,000 combined. I'll have much more later … from http://www.calculatedriskblog.com/2020/11/october-employment-report-638-thousand.html
Note: Both Black Knight and the MBA (Mortgage Bankers Association) are putting out weekly estimates of mortgages in forbearance.
This data is as of November 3rd. From Black Knight: Forbearance Fall 5% After Slight Increase After last week’s slight increase, the latest data from Black Knight’s McDash Flash Forbearance Tracker shows that nationwide forbearance volumes have fallen by 152,000 (-5%) since last Tuesday, driven by October forbearance expiration activity. This was roughly what was expected for the first week of the month, though we will be on the lookout for further potential drops, given the remaining scheduled expirations. With some 161,000 active forbearance plans having expired at the end of October, additional extension and/or removal activity could be seen in coming days. from http://www.calculatedriskblog.com/2020/11/black-knight-number-of-homeowners-in.html |

 RSS Feed
