|
From the Department of Commerce reported:
The U.S. Census Bureau and the U.S. Bureau of Economic Analysis announced today that the goods and services deficit was $63.9 billion in September, down $3.2 billion from $67.0 billion in August, revised. 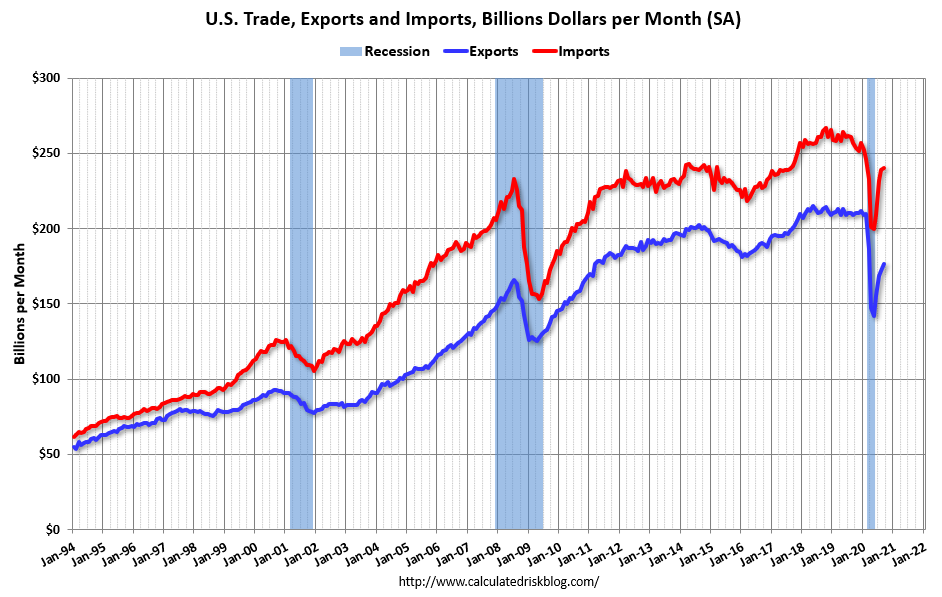 Click on graph for larger image. Click on graph for larger image.Both exports and imports increased in September. Exports are down 16% compared to September 2019; imports are down 6.5% compared to September 2019. Both imports and exports decreased sharply due to COVID-19, and have now bounced back (imports more than exports), The second graph shows the U.S. trade deficit, with and without petroleum.  The blue line is the total deficit, and the black line is the petroleum deficit, and the red line is the trade deficit ex-petroleum products. The blue line is the total deficit, and the black line is the petroleum deficit, and the red line is the trade deficit ex-petroleum products.Note that the U.S. exported a slight net positive petroleum products in recent months. Oil imports averaged $37.59 per barrel in September, up from $37.43 per barrel in August, and down from $53.10 in September 2019. The trade deficit with China decreased to $29.7 billion in September, from $31.6 billion in September 2019. from http://www.calculatedriskblog.com/2020/11/trade-deficit-decreased-to-639-billion.html
0 Comments
From ADP:
Private sector employment increased by 365,000 jobs from September to October according to the October ADP National Employment Report®. ... The report, which is derived from ADP’s actual payroll data, measures the change in total nonfarm private employment each month on a seasonally-adjusted basis.This was below the consensus forecast for 650 thousand private sector jobs added in the ADP report. The BLS report will be released Friday, and the consensus is for 600 thousand non-farm payroll jobs added in October. Of course the ADP report has not been very useful in predicting the BLS report. from http://www.calculatedriskblog.com/2020/11/adp-private-employment-increased-365000.html
From the MBA: Mortgage Applications Increase in Latest MBA Weekly Survey
Mortgage applications increased 3.8 percent from one week earlier, according to data from the Mortgage Bankers Association’s (MBA) Weekly Mortgage Applications Survey for the week ending October 30, 2020.  Click on graph for larger image. Click on graph for larger image.The first graph shows the refinance index since 1990. The refinance index has been very volatile recently depending on rates and liquidity. But with record low rates, the index remains up significantly from last year.  The second graph shows the MBA mortgage purchase index The second graph shows the MBA mortgage purchase indexAccording to the MBA, purchase activity is up 25% year-over-year unadjusted. Note: Red is a four-week average (blue is weekly). from http://www.calculatedriskblog.com/2020/11/mba-mortgage-applications-increase-in.html
Wednesday:
• At 7:00 AM ET, The Mortgage Bankers Association (MBA) will release the results for the mortgage purchase applications index. • At 8:15 AM, The ADP Employment Report for October. This report is for private payrolls only (no government). The consensus is for 650,000 jobs added, down from 749,000 in September. • At 8:30 AM, Trade Balance report for September from the Census Bureau. The consensus is for the deficit to be $64.0 billion in September, from $67.1 billion in August. • At 10:00 AM, the ISM Services Index for October. The consensus is for a decrease to 57.5 from 57.8. from http://www.calculatedriskblog.com/2020/11/wednesday-adp-employment-trade-deficit.html
Note: I look forward to when I will not be posting this daily!
The US is now averaging close to 1 million tests per day. Based on the experience of other countries, for adequate test-and-trace (and isolation) to reduce infections, the percent positive needs to be well under 5% (probably close to 1%), so the US still needs to increase the number of tests per day significantly (or take actions to push down the number of new infections). There were 927,029 test results reported over the last 24 hours. There were 86,507 positive tests. (New Tuesday record) Almost 2,000 US deaths have been reported so far in November. See the graph on US Daily Deaths here.  Click on graph for larger image. Click on graph for larger image.This data is from the COVID Tracking Project. The percent positive over the last 24 hours was 9.3% (red line is 7 day average). For the status of contact tracing by state, check out testandtrace.com. And check out COVID Exit Strategy to see how each state is doing.  The second graph shows the 7 day average of positive tests reported. The second graph shows the 7 day average of positive tests reported.The dashed line is the July high. Note that there were very few tests available in March and April, and many cases were missed (the percent positive was very high - see first graph). By June, the percent positive had dropped below 5%. This is a new record 7-day average cases for the USA. from http://www.calculatedriskblog.com/2020/11/november-3-covid-19-test-results.html
From Merrill Lynch:
We expect growth to slow to 3% qoq saar in 4Q amid the stimulus stalemate. [Oct 30 estimate]From Goldman Sachs: We left our Q4 GDP tracking estimate unchanged at +4.5%. [Nov 3 estimate]From the NY Fed Nowcasting Report The New York Fed Staff Nowcast stands at 3.2% for 2020:Q4. [Oct 30 estimate]And from the Altanta Fed: GDPNow The GDPNow model estimate for real GDP growth (seasonally adjusted annual rate) in the fourth quarter of 2020 is 3.4 percent on November 2, up from 2.2 percent on October 30. [Nov 2 estimate]It is important to note that GDP is reported at a seasonally adjusted annual rate (SAAR). A 3.3% annualized increase in Q4 GDP, is about 0.8% QoQ, and would leave real GDP down about 2.7% from Q4 2019. The following graph illustrates this decline. 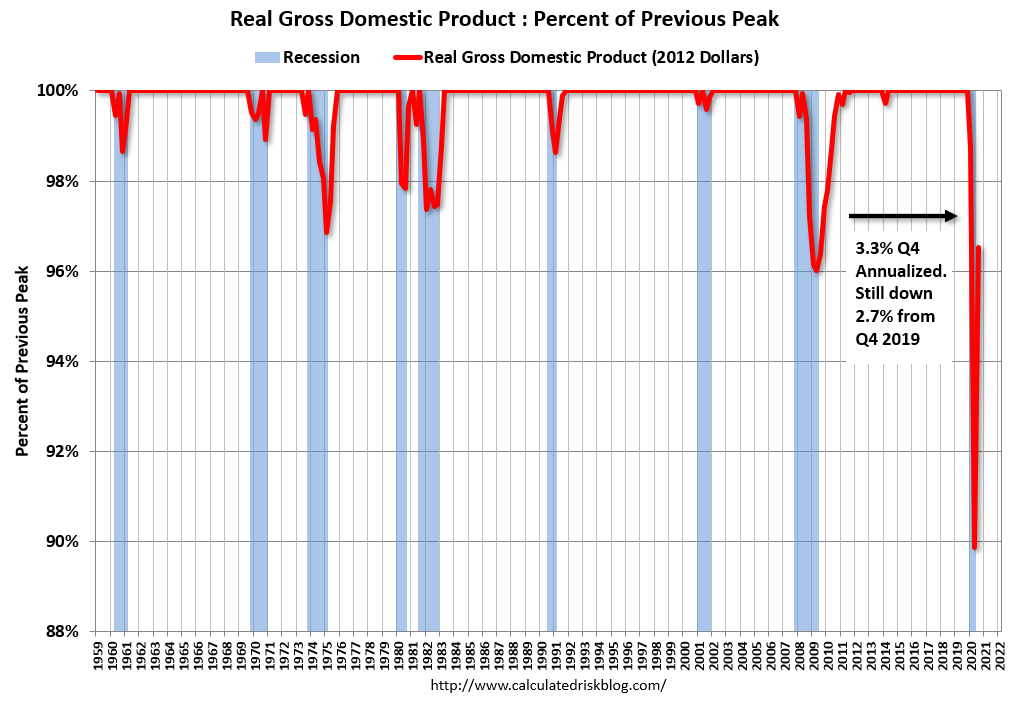 Click on graph for larger image. Click on graph for larger image.This graph shows the percent decline in real GDP from the previous peak (currently the previous peak was in Q4 2019). This graph is through Q3 2020, and real GDP is currently off 3.5% from the previous peak. For comparison, at the depth of the Great Recession, real GDP was down 4.0% from the previous peak. The black arrow shows what a 3.3% annualized increase in real GDP would look like in Q4. from http://www.calculatedriskblog.com/2020/11/early-q4-gdp-forecasts.html
Here is another monthly update on framing lumber prices.
This graph shows CME framing futures through Oct 30th.  Click on graph for larger image in graph gallery. Click on graph for larger image in graph gallery.
This is down sharply from late August, but still up 23% year-over-year.
There is a seasonal pattern for lumber prices, and usually prices will increase in the Spring, and peak around May, and then bottom around October or November - although there is quite a bit of seasonal variability. Clearly there was a surge in demand for lumber mid-year, but the mills are now catching up. from http://www.calculatedriskblog.com/2020/11/update-framing-lumber-prices-up-23-year.html
Notes: This CoreLogic House Price Index report is for September. The recent Case-Shiller index release was for August. The CoreLogic HPI is a three month weighted average and is not seasonally adjusted (NSA).
From CoreLogic: Powering Up in 2020: Annual U.S. Home Price Appreciation Jumped to Six-Year High in September, CoreLogic Reports CoreLogic® ... today released the CoreLogic Home Price Index (HPI™) and HPI Forecast™ for September 2020. Nationally, home prices increased 6.7% in September 2020, compared with September 2019, marking the fastest annual acceleration since May 2014. On a month-over-month basis, home prices increased by 1.1% compared to August 2020. from http://www.calculatedriskblog.com/2020/11/corelogic-house-prices-up-67-year-over.html
Note: I look forward to when I will not be posting this daily!
The US is now averaging close to 1 million tests per day. Based on the experience of other countries, the percent positive needs to be well under 5% to really push down new infections (probably close to 1%), so the US still needs to increase the number of tests per day significantly (or take actions to push down the number of new infections). There were 1,142,923 test results reported over the last 24 hours. There were 82,895 positive tests. (New Monday record) This is the highest 7-day average for deaths since the first half of September. See the graph on US Daily Deaths here.  Click on graph for larger image. Click on graph for larger image.This data is from the COVID Tracking Project. The percent positive over the last 24 hours was 7.5% (red line is 7 day average). For the status of contact tracing by state, check out testandtrace.com. And check out COVID Exit Strategy to see how each state is doing.  The second graph shows the 7 day average of positive tests reported. The second graph shows the 7 day average of positive tests reported.The dashed line is the July high. Note that there were very few tests available in March and April, and many cases were missed (the percent positive was very high - see first graph). By June, the percent positive had dropped below 5%. This is a new record 7-day average cases for the USA. from http://www.calculatedriskblog.com/2020/11/november-2-covid-19-test-results.html
Note: This is as of October 25th.
From the MBA: Share of Mortgage Loans in Forbearance Decreases to 5.83% The Mortgage Bankers Association’s (MBA) latest Forbearance and Call Volume Survey revealed that the total number of loans now in forbearance decreased by 7 basis points from 5.90% of servicers’ portfolio volume in the prior week to 5.83% as of October 25, 2020. According to MBA’s estimate, 2.9 million homeowners are in forbearance plans. 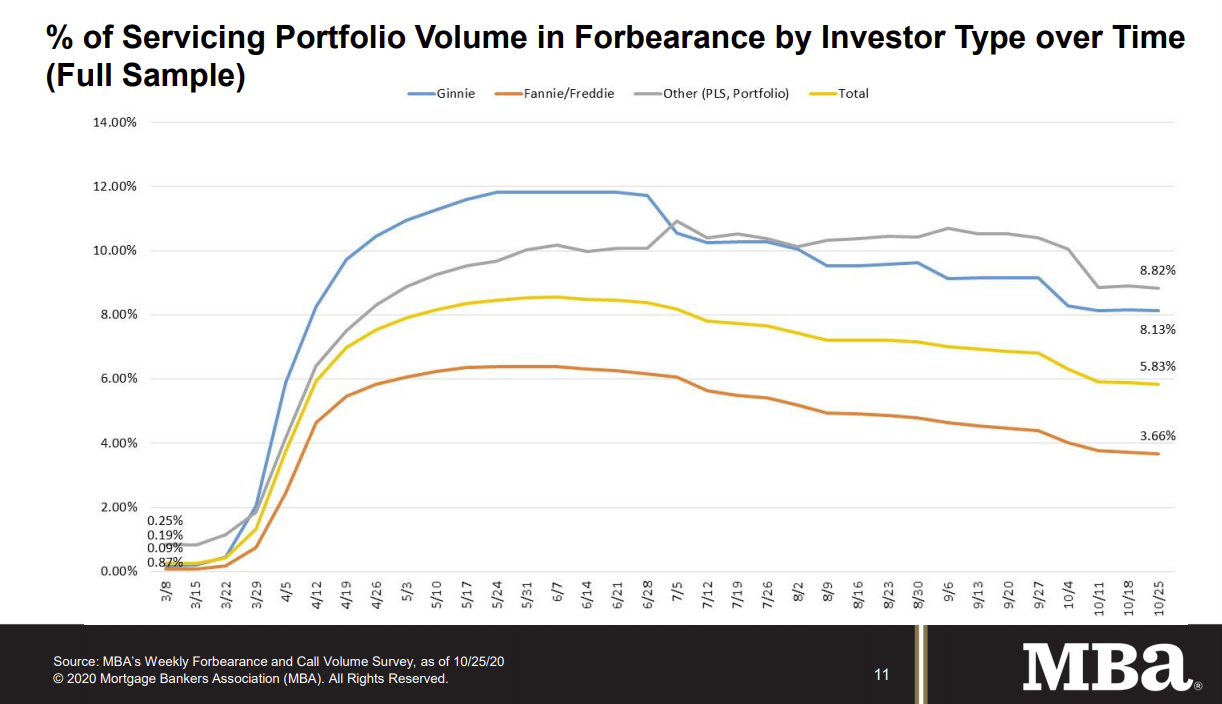 Click on graph for larger image. Click on graph for larger image.This graph shows the percent of portfolio in forbearance by investor type over time. Most of the increase was in late March and early April, and has been trending down for the last few months. The MBA notes: "Total weekly forbearance requests as a percent of servicing portfolio volume (#) decreased relative to the prior week: from 0.11% to 0.10%." There hasn't been a pickup in forbearance activity related to the end of the extra unemployment benefits, but improvement might haved slowed. from http://www.calculatedriskblog.com/2020/11/mba-survey-share-of-mortgage-loans-in.html |
 RSS Feed
