|
From the BLS:
The Consumer Price Index for All Urban Consumers (CPI-U) was unchanged in October on a seasonally adjusted basis after rising 0.2 percent in September, the U.S. Bureau of Labor Statistics reported today. Over the last 12 months, the all items index increased 1.2 percent before seasonal adjustment.Overall inflation was lower than expectations in October. I'll post a graph later today after the Cleveland Fed releases the median and trimmed-mean CPI. from http://www.calculatedriskblog.com/2020/11/bls-cpi-unchanged-in-october-core-cpi.html
0 Comments
Thursday:
• At 8:30 AM ET, The initial weekly unemployment claims report will be released. The consensus is initial claims decreased to 725 thousand from 751 thousand last week. • Also at 8:30 AM, The Consumer Price Index for October from the BLS. The consensus is for a 0.2% increase in CPI, and a 0.2% increase in core CPI. from http://www.calculatedriskblog.com/2020/11/thursday-cpi-unemployment-claims.html
The end of the pandemic is coming, possibly by Q2 2021! Please be careful, especially over the holidays. Thanksgiving, Christmas and New Years will be tough this year, but keep your guard up - plan now to have safe holidays.
The US is now averaging over 1 million tests per day. Based on the experience of other countries, for adequate test-and-trace (and isolation) to reduce infections, the percent positive needs to be well under 5% (probably close to 1%), so the US still needs to increase the number of tests per day significantly (or take actions to push down the number of new infections). There were 1,134,101 test results reported over the last 24 hours. There were 144,270 positive tests. This is a new record. Almost 11,000 US deaths have been reported so far in November. See the graph on US Daily Deaths here. 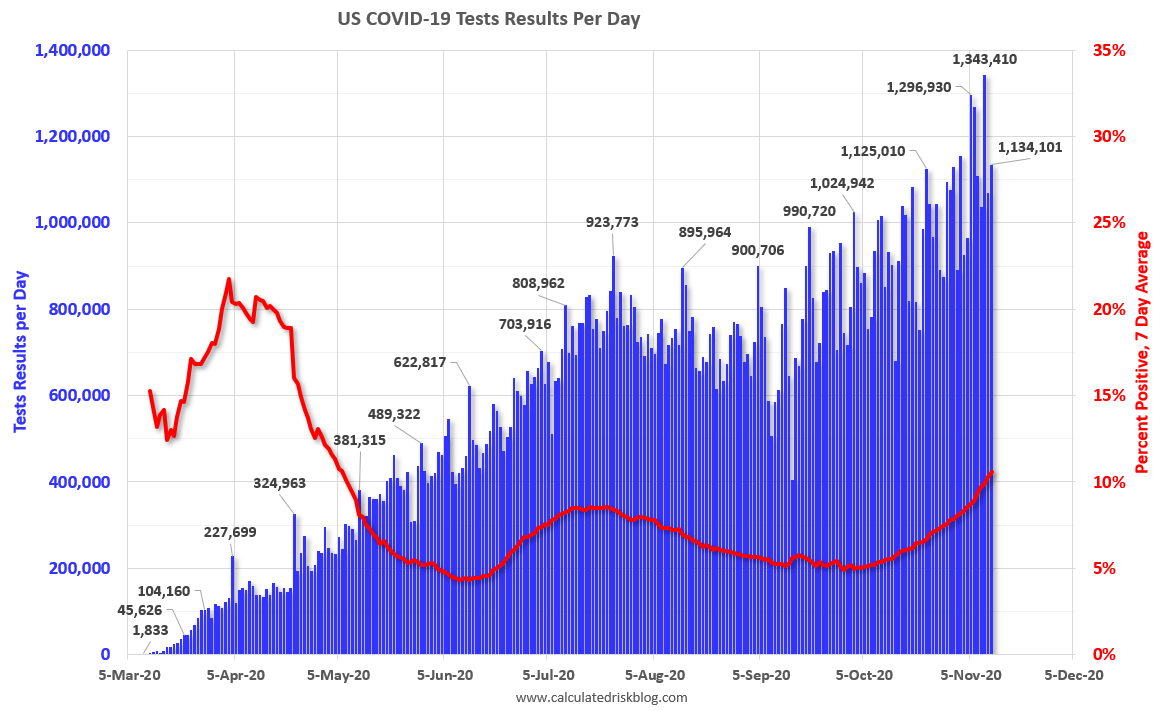 Click on graph for larger image. Click on graph for larger image.This data is from the COVID Tracking Project. The percent positive over the last 24 hours was 12.7% (red line is 7 day average). For the status of contact tracing by state, check out testandtrace.com. And check out COVID Exit Strategy to see how each state is doing. 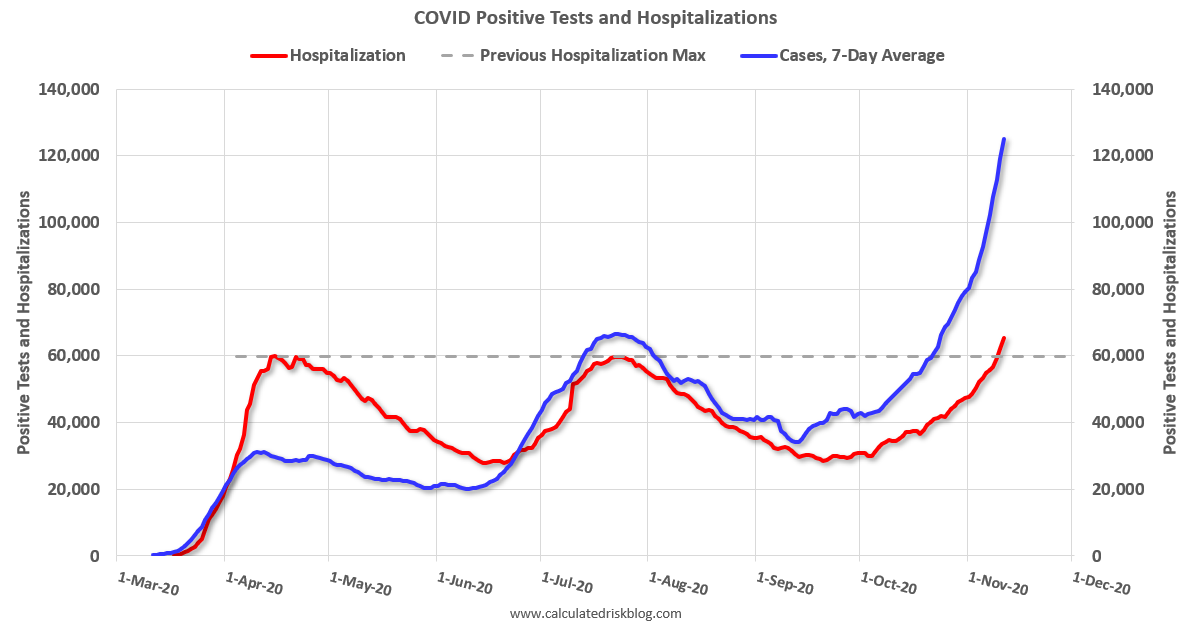 The second graph shows the 7 day average of positive tests reported and daily hospitalizations. The second graph shows the 7 day average of positive tests reported and daily hospitalizations.The dashed line is the previous hospitalization maximum. Note that there were very few tests available in March and April, and many cases were missed, so the hospitalizations was higher relative to the 7-day average of positive tests in July.
Now, there are many more tests, and many cases are being detected earlier - so hospitalizations have lagged. Hospitalizations are now at a new record. This is a new record 7-day average cases for the USA. from http://www.calculatedriskblog.com/2020/11/november-11-covid-19-test-results.html
From the HAR: Houston Real Estate Soars Again in October
Even with an ever-dwindling supply of housing and a lingering pandemic, consumers bought homes at a frenzied pace in October, keeping the Houston real estate market on the path to a record year. The high end of the market once again registered the greatest sales volume increase, with mid-range homes also attracting heavy activity.Inventory declined 25.9% year-over-year from 42,374 in October 2019 to 31,384 in October 2020. Note that the closed sales in October were for contracts that were mostly signed in August and September. from http://www.calculatedriskblog.com/2020/11/houston-real-estate-in-october-sales-up.html
Towards the end of each year I collect some housing forecasts for the following year. This is just a beginning (I'll gather many more).
The table below shows a few forecasts for 2021: From Fannie Mae: Housing Forecast: October 2020 From Freddie Mac: Freddie Mac Quarterly Forecast: Housing Market Continues to Rebound as Mortgage Rates Hover at Record Lows From NAHB: Housing and Interest Rate Forecast, 11/10/2020 From NAR: U.S. Economic Outlook: September 2020 Note: For comparison, new home sales in 2020 will probably be around 820 thousand, and total housing starts around 1.360 million.
from http://www.calculatedriskblog.com/2020/11/first-look-2021-housing-forecasts.html
From the MBA: Mortgage Applications Decrease in Latest MBA Weekly Survey
Mortgage applications decreased 0.5 percent from one week earlier, according to data from the Mortgage Bankers Association’s (MBA) Weekly Mortgage Applications Survey for the week ending November 6, 2020. 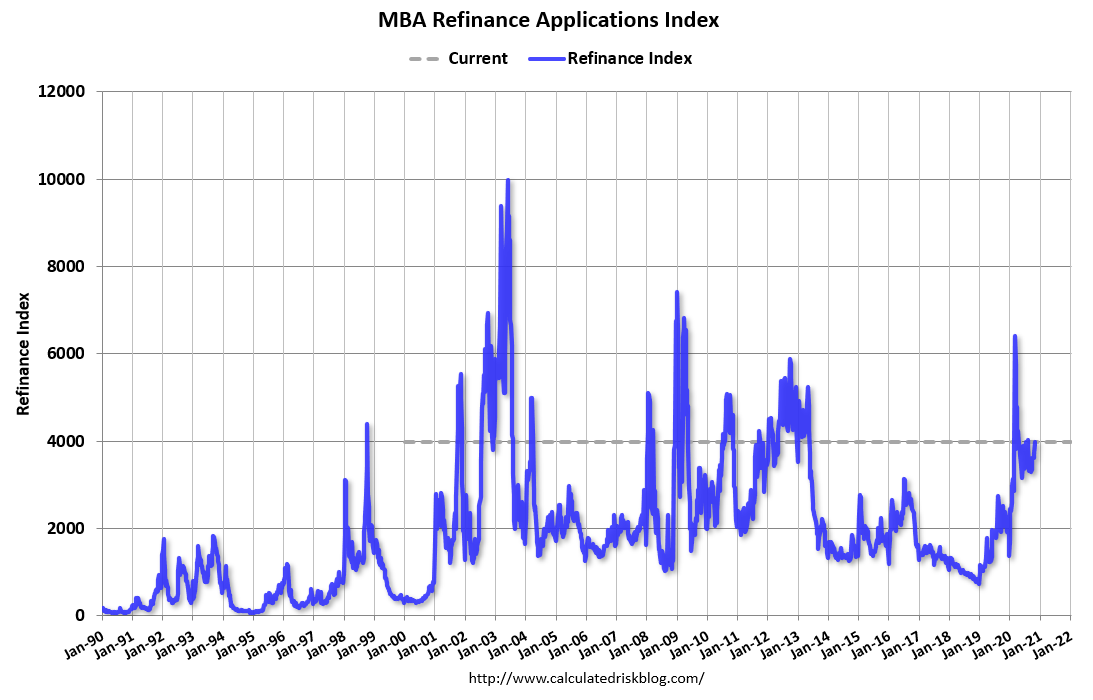 Click on graph for larger image. Click on graph for larger image.The first graph shows the refinance index since 1990. The refinance index has been very volatile recently depending on rates and liquidity. But with record low rates, the index remains up significantly from last year. 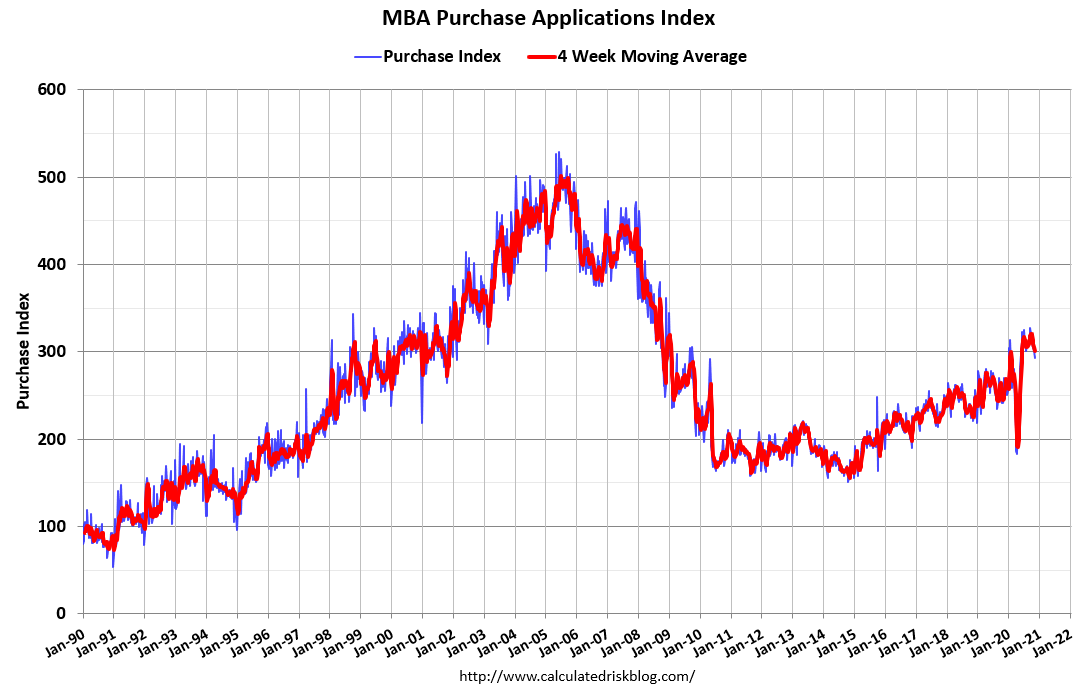 The second graph shows the MBA mortgage purchase index The second graph shows the MBA mortgage purchase indexAccording to the MBA, purchase activity is up 16% year-over-year unadjusted. Note: Red is a four-week average (blue is weekly). from http://www.calculatedriskblog.com/2020/11/mba-mortgage-applications-decrease-in.html
The end of the pandemic is coming, possibly by Q2 2021! Please be careful, especially over the holidays. Thanksgiving, Christmas and New Years will be tough this year, but keep your guard up - plan now to have safe holidays.
The US is now averaging over 1 million tests per day. Based on the experience of other countries, for adequate test-and-trace (and isolation) to reduce infections, the percent positive needs to be well under 5% (probably close to 1%), so the US still needs to increase the number of tests per day significantly (or take actions to push down the number of new infections). There were 1,069,405 test results reported over the last 24 hours. There were 130,989 positive tests. This is a new record. Over 9,000 US deaths have been reported so far in November. See the graph on US Daily Deaths here.  Click on graph for larger image. Click on graph for larger image.This data is from the COVID Tracking Project. The percent positive over the last 24 hours was 12.2% (red line is 7 day average). For the status of contact tracing by state, check out testandtrace.com. And check out COVID Exit Strategy to see how each state is doing. 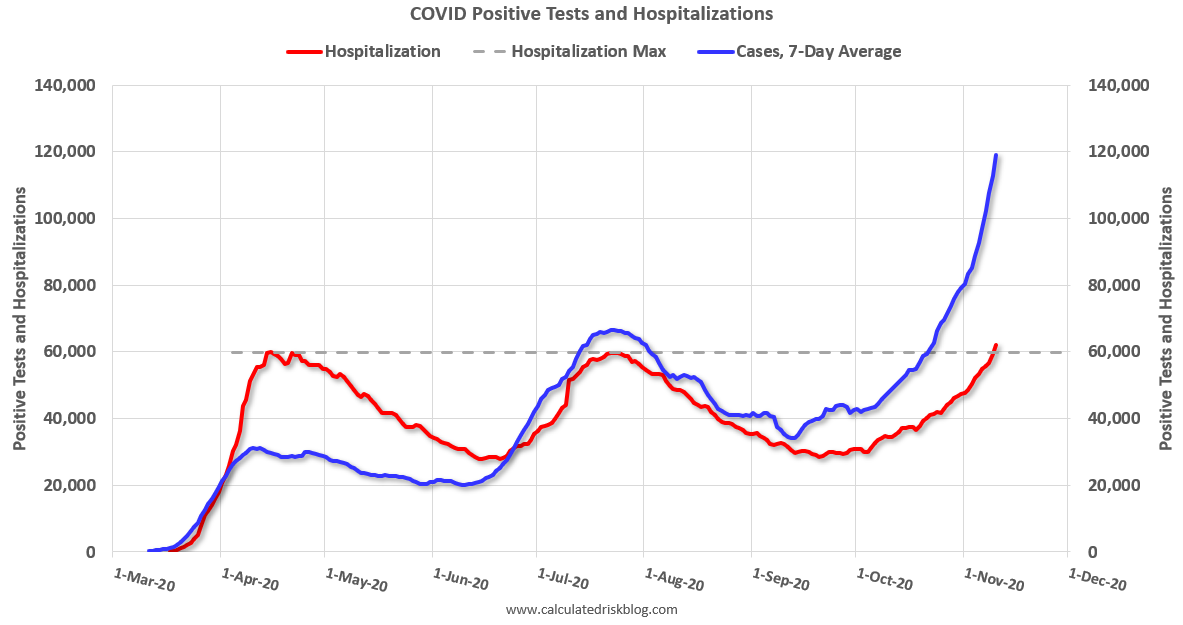 The second graph shows the 7 day average of positive tests reported and daily hospitalizations. The second graph shows the 7 day average of positive tests reported and daily hospitalizations.The dashed line is the previous hospitalization maximum. Note that there were very few tests available in March and April, and many cases were missed, so the hospitalizations was higher relative to the 7-day average of positive tests in July.
Now, there are many more tests, and many cases are being detected earlier - so hospitalizations have lagged. Hospitalizations are now at a new record. This is a new record 7-day average cases for the USA. from http://www.calculatedriskblog.com/2020/11/november-10-covid-19-test-results.html
From the NMHC: NMHC Rent Payment Tracker Finds 80.4 Percent of Apartment Households Paid Rent as of November 6
The National Multifamily Housing Council (NMHC)’s Rent Payment Tracker found 80.4 percent of apartment households made a full or partial rent payment by November 6 in its survey of 11.5 million units of professionally managed apartment units across the country. This graph from the NMHC Rent Payment Tracker shows the percent of household making full or partial rent payments by the 6th of the month. CR Note: This is mostly for large, professionally managed properties. There are some timing issues month to month, but rent payments are mostly holding steady - and not falling off a cliff. from http://www.calculatedriskblog.com/2020/11/nmhc-rent-payment-tracker-shows.html
From the MBA: Mortgage Delinquencies Decrease in the Third Quarter of 2020
The delinquency rate for mortgage loans on one-to-four-unit residential properties decreased to a seasonally adjusted rate of 7.65 percent of all loans outstanding at the end of the third quarter of 2020, according to the Mortgage Bankers Association’s (MBA) National Delinquency Survey. 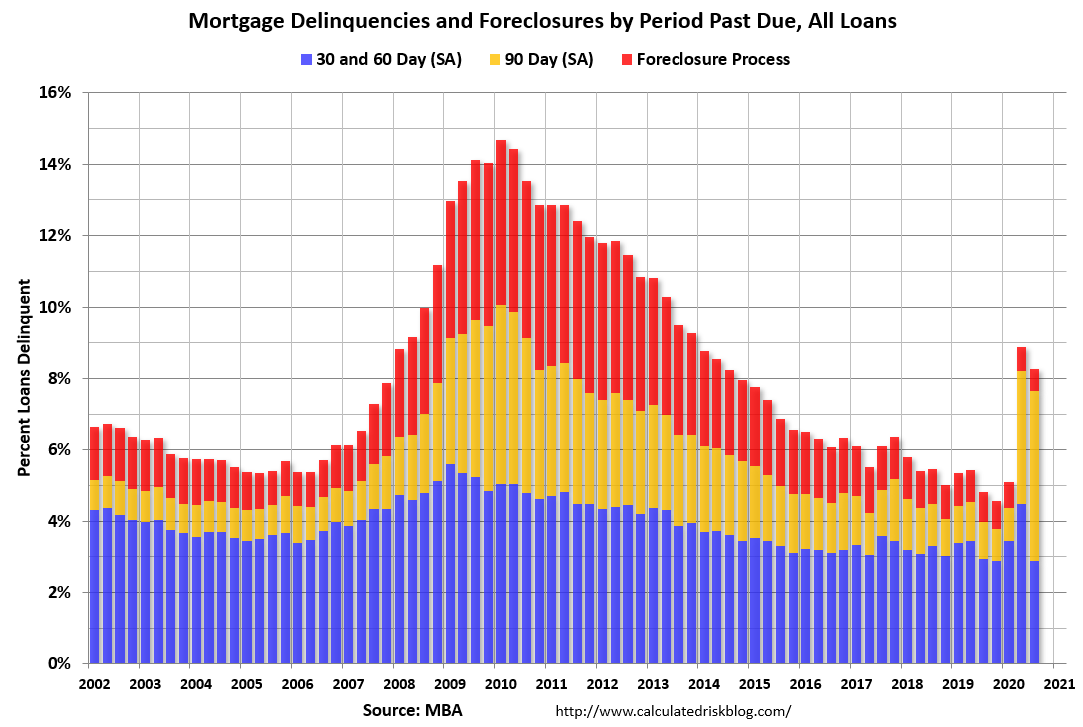 Click on graph for larger image. Click on graph for larger image.This graph shows the percent of loans delinquent by days past due. Overall delinquencies decreased in Q3. The decrease was in the 30 day and 60 and day buckets.
From the MBA: "Compared to last quarter, the seasonally adjusted mortgage delinquency rate decreased for all loans outstanding. By stage, the 30-day delinquency rate decreased 48 basis points to 1.86 percent, the lowest rate since the survey began in 1979. The 60-day delinquency rate decreased 113 basis points to 1.02 percent, and the 90-day delinquency bucket increased 106 basis points to 4.78 percent, the highest rate since the second quarter of 2010." This sharp increase in the 90-day bucket was due to loans in forbearance (included as delinquent, but not reported to the credit bureaus). The percent of loans in the foreclosure process declined further, and was at the lowest level since 1982. from http://www.calculatedriskblog.com/2020/11/mba-mortgage-delinquencies-decrease-in.html
From the BLS: Job Openings and Labor Turnover Summary
The number of job openings was little changed at 6.4 million on the last business day of September, the U.S. Bureau of Labor Statistics reported today. Hires and total separations were little changed at 5.9 million and 4.7 million, respectively. Within separations, the quits rate was little changed at 2.1 percent while the layoffs and discharges rate decreased to a series low of 0.9 percent.The following graph shows job openings (yellow line), hires (dark blue), Layoff, Discharges and other (red column), and Quits (light blue column) from the JOLTS. This series started in December 2000. Note: The difference between JOLTS hires and separations is similar to the CES (payroll survey) net jobs headline numbers. This report is for September, the most recent employment report was for October.  Click on graph for larger image. Click on graph for larger image.Note that hires (dark blue) and total separations (red and light blue columns stacked) are usually pretty close each month. This is a measure of labor market turnover. When the blue line is above the two stacked columns, the economy is adding net jobs - when it is below the columns, the economy is losing jobs. The huge spikes in layoffs and discharges in March and April 2020 are labeled, but off the chart to better show the usual data. Jobs openings increased in September to 6.436 million from 6.352 million in August. The number of job openings (yellow) were down 8.7% year-over-year. Quits were down 12% year-over-year. These are voluntary separations. (see light blue columns at bottom of graph for trend for "quits"). Job openings were little changed in September, and are down YoY - and quits are down sharply YoY. from http://www.calculatedriskblog.com/2020/11/bls-job-openings-little-changed-at-64.html |
||||||||||||||||||||||||||||||||||||
 RSS Feed
